This page will be continuously updated with the latest bicycle accident statistics from Los Angeles and California.
Page last updated: January 2023
The Numbers Behind the Dangers for Los Angeles Cyclists
People are drawn to Los Angeles because it is a city that is always in motion. The fast pace of life in La-La Land can have its drawbacks though, especially for cyclists. All that momentum often spills out into the streets in the form of speeding and careless drivers trying to get from one famous neighborhood to the next.
Someone on a bike can face distracted drivers, confusing lane markings, and rough patches of pavement all in a single block. These hazards threaten the physical health of bicyclists and claim precious lives every year. If we are able to step back and visualize the heartbreaking bicycle accident numbers the city records each day, perhaps solutions to provide safer rides will emerge and be acted upon more quickly.
Los Angeles City Bicycle Accident Statistics
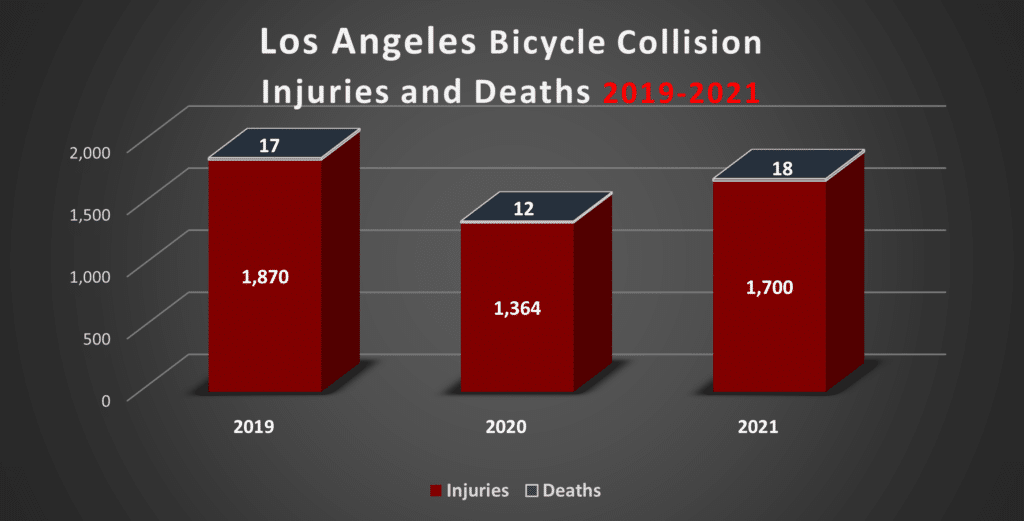
The City of Los Angeles tragically lost 18 lives in 2021 bicycle collisions with an estimated 1,700 bicycle injuries reported. The figures for 2021 are estimated with the help of L.A. Times data that shows that bicycle accidents increased around 25% in 2021 over 2020 numbers.
Data from past years was taken from California’s Transportation Injury Mapping System (TIMS). However, more recent bicycle accident statistics have been called into question by some experts. These experts feel that bicycle accidents are now vastly under reported by officers and the media. They point to evidence that shows that law enforcement have mostly been reporting bike accidents that involve a crime, such as hit-and-runs. Another factor may be that news outlets are covering fewer accidents due to reduced staffing since 2020 and the pandemic.
As 2023 gets underway, it may be a while before official 2022 bicycle accident statistics are finalized and totaled. An unofficial count by BikingInLA recorded at least 14 cycling deaths in L.A. as of December 2022. That count is likely to rise and perhaps continue the upward trend in fatalities since 2020 as seen below.
Bicycling.com recently called Los Angeles the worst bike city in America. They cited factors like notorious traffic levels and poor pavement conditions and a few other factors that Bicycling.com called out as the biggest hazards of all, “they are hostile, speeding, or distracted drivers, and a legal system that goes easy on them.”
Bicycling.com also pointed out that data on accidents from 2014 to 2016 shows Los Angeles County itself had more cycling fatalities than most states over that span, other than Florida, New York, and California.
Bicycling Accident Numbers Nationally
The CDC reports that somewhere around a thousand bicyclists are killed every year in the U.S. Over 130,000 are injured in crashes. About one-third of fatal bicycle crashes involve alcohol use by the motor vehicle driver or the rider.
NPR reported that nationally, 1,260 cyclists lost their lives in 2020. That was up around 16% from 2019. The shocking numbers rose an estimated 5% between 2020 and 2021.
Los Angeles County Bicycle Accident Statistics
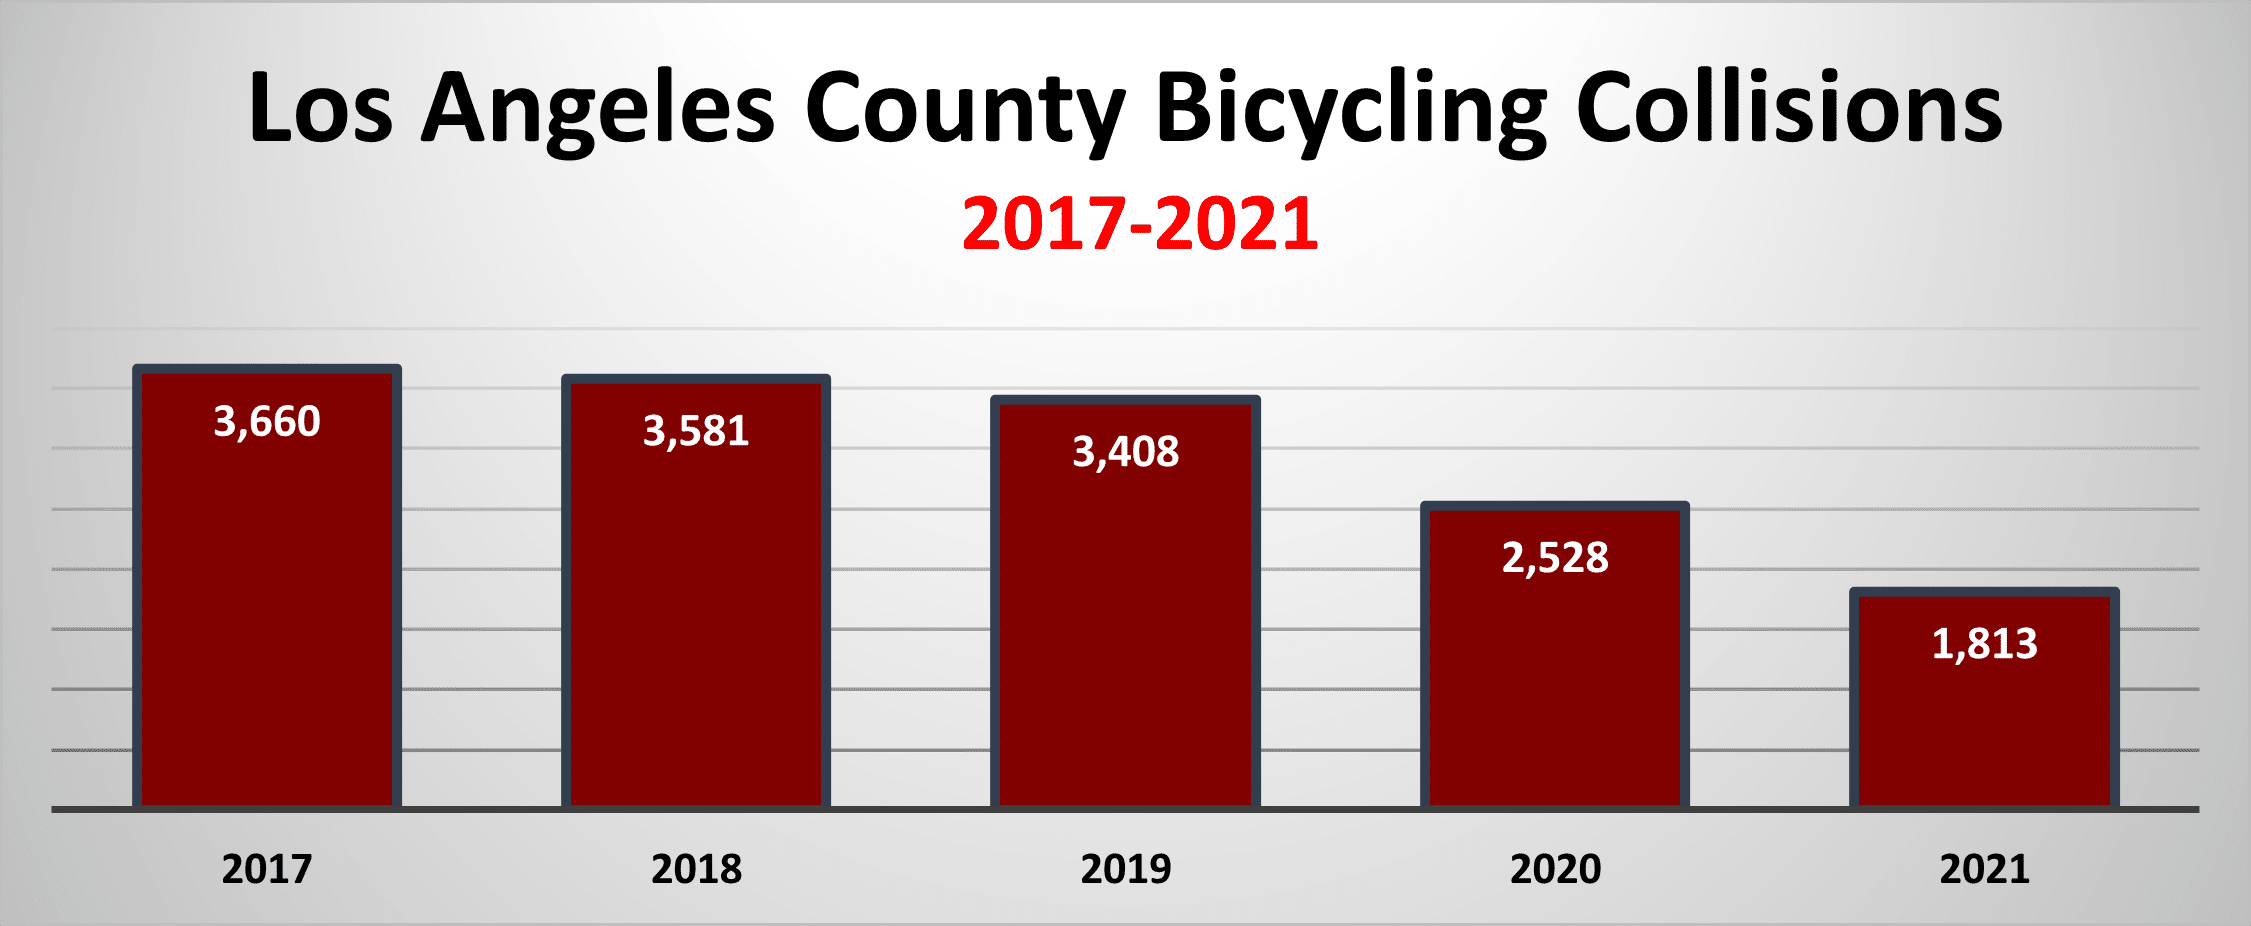
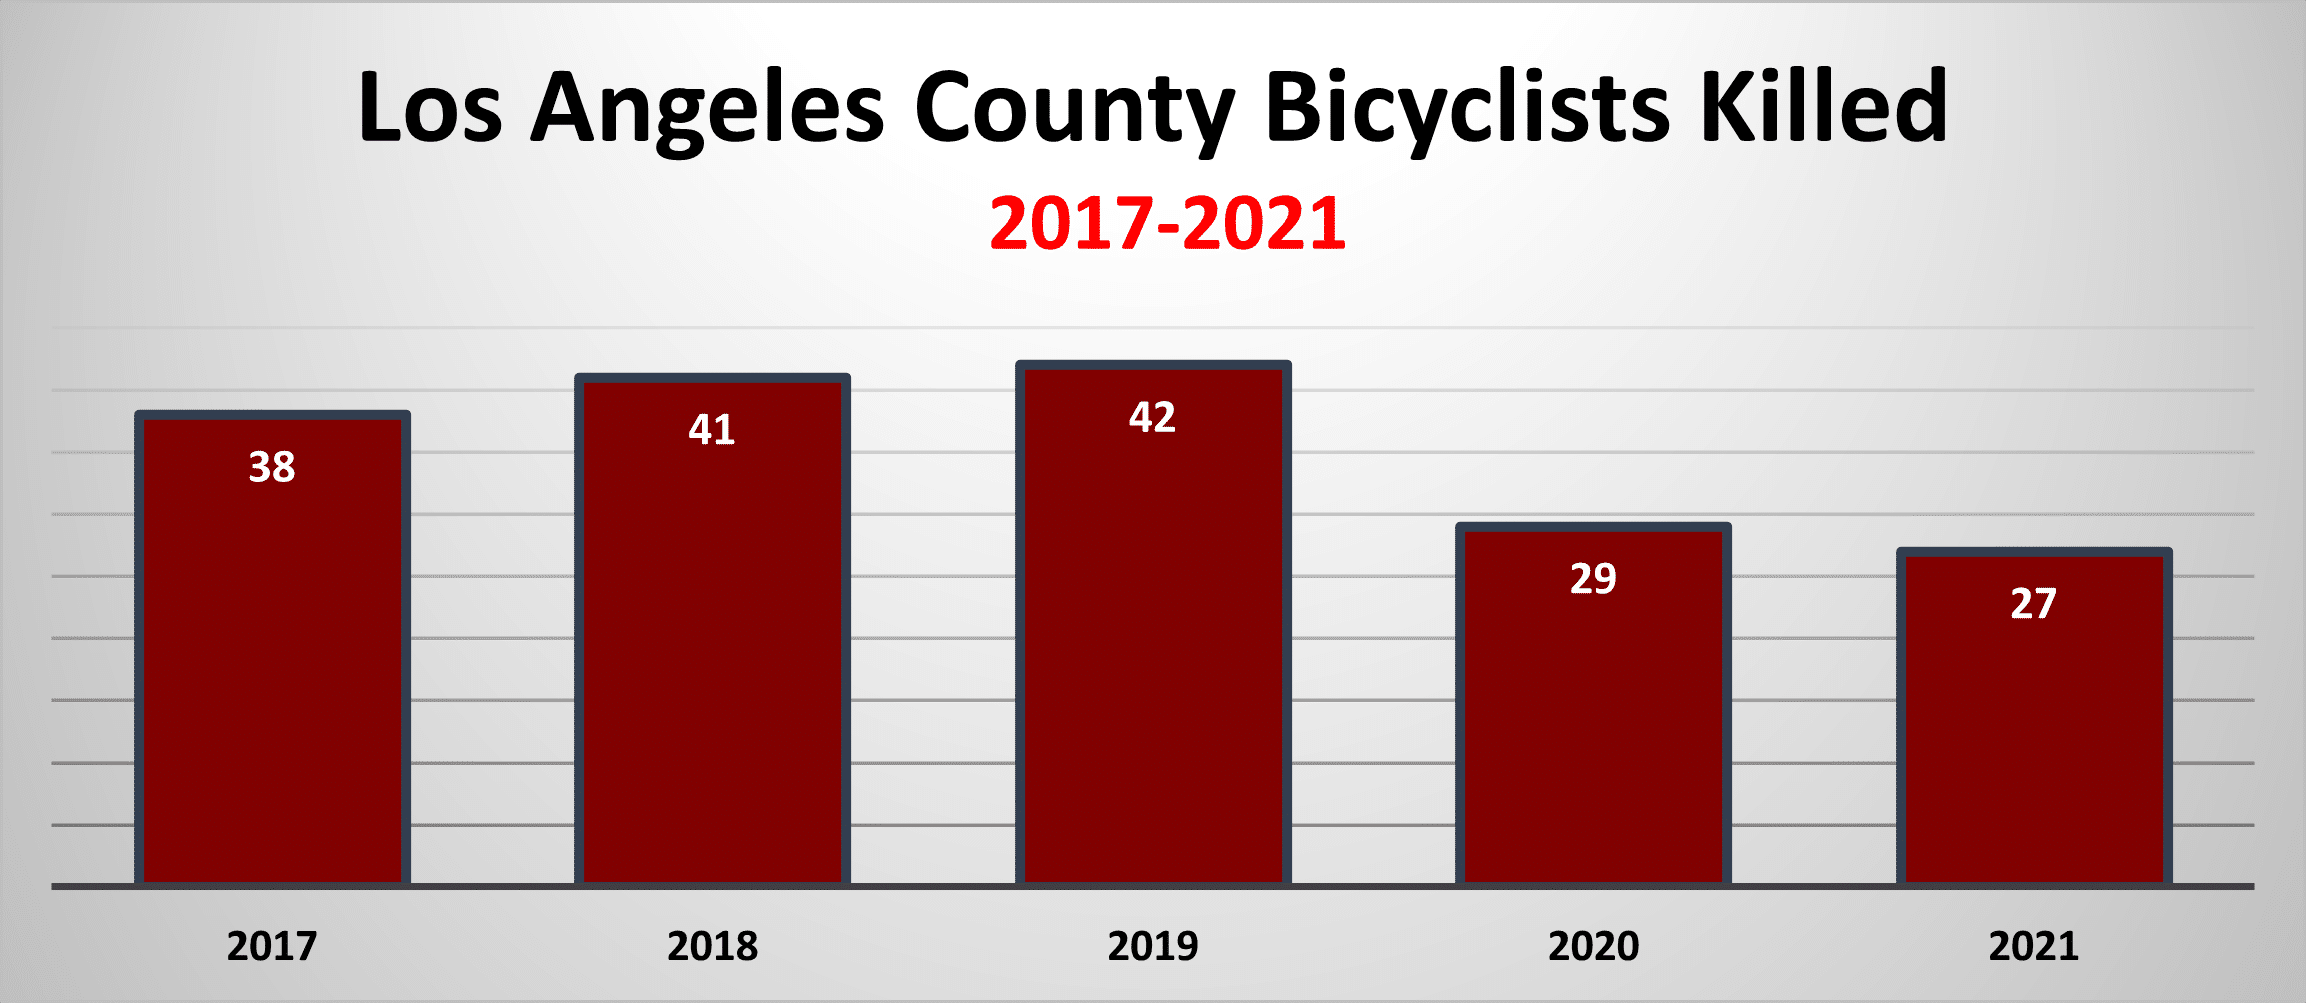
Across all of Los Angeles County, 2021 brought with it 1,813 bicycle accidents leading to 27 tragic deaths (TIMS).
Since 2017, L.A. County has seen an average of around 3,400 bicycle accidents involving injury each year. Injury rates across the county have seen a steady decline over that span, with the highest collision rate recorded in 2017. 2021 continued the positive drop in crashes and it’s hoped that once 2022 statistics are officially released they’ll be even lower. But keep in mind that it’s possible these recorded drops are simply a product of fewer bicycle accident being officially reported. (CATSIP)
Since 2016, Los Angeles County has averaged 36 bicyclist deaths a year. The highest death toll was seen in 2019 with 42 victims.
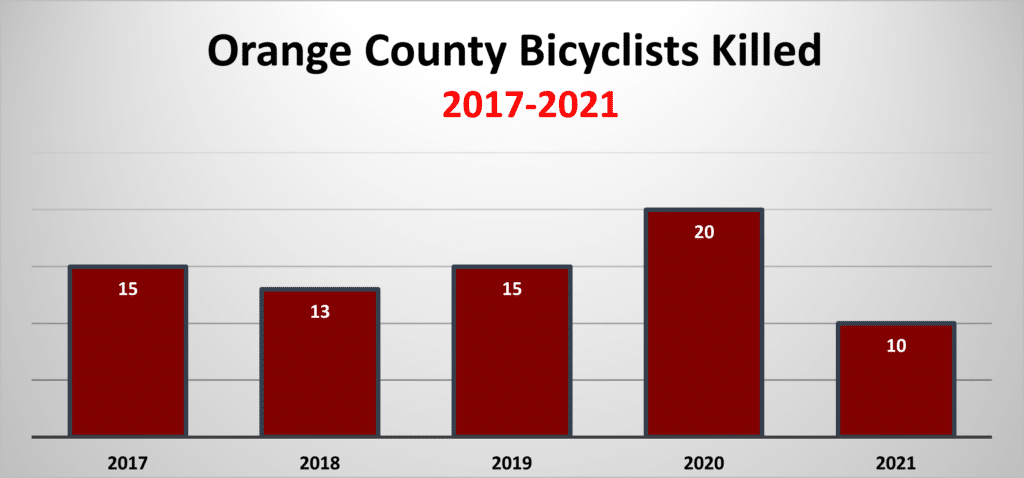
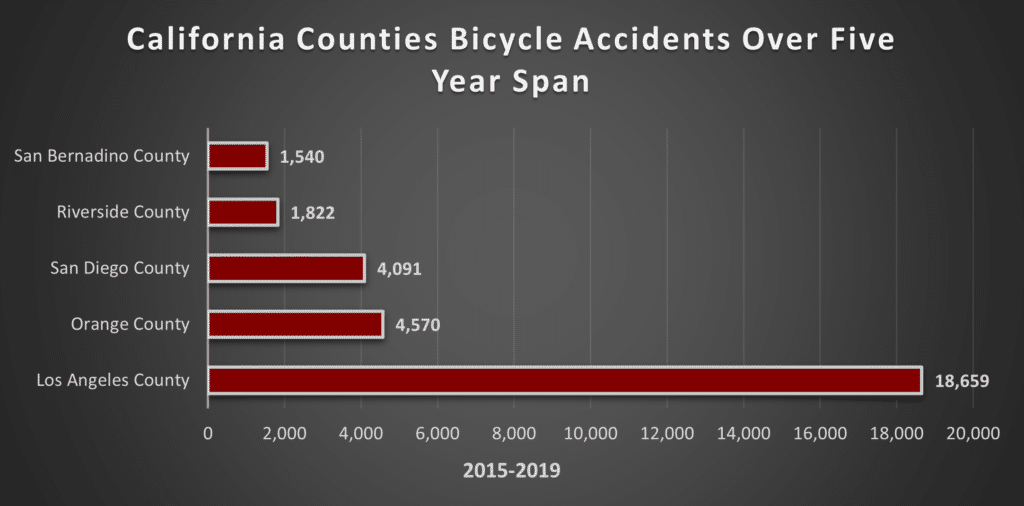
Orange County ranked second overall among California counties for bicycle collisions reported from 2015-2019 with 4,570 cases. For comparison to Los Angeles County, here is a list of Orange County’s bicycle accident fatalities tracked over five years. The county ranks near the top in fatalities. Still, the data shows the wide gap between Los Angeles County and the other 58 counties in The Golden State.
Over five years, Los Angeles County ranks number one from 2015-1019 with over 18,000 total bicycle accidents. Surveying some other Southern California Counties like San Diego shows the disparity that exists between L.A. and the rest of the region. (UC Berkeley)
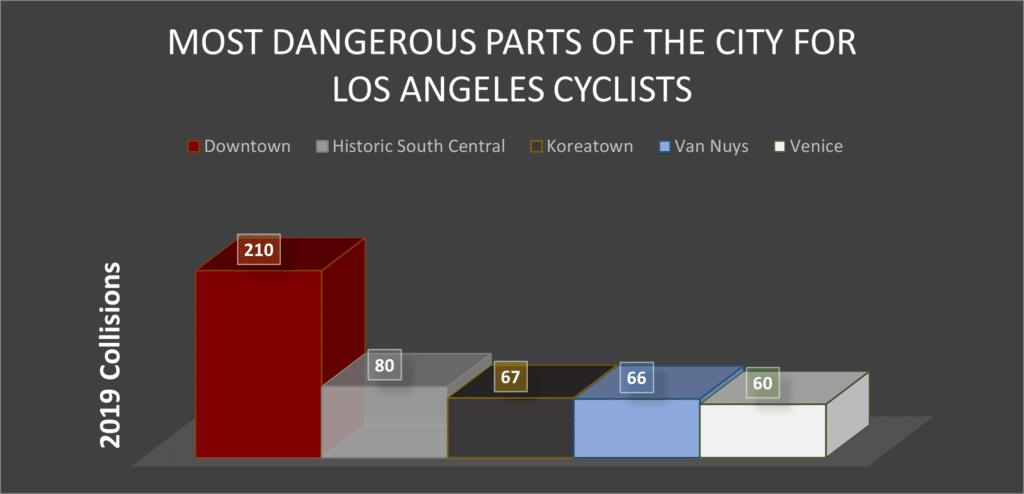
The Most Dangerous Neighborhoods for Cyclists In L.A.
Downtown Los Angeles was overwhelmingly the most hazardous place in the city for cyclists. The area saw 210 bicycle accidents in 2019, up one and a half percent from 2018. Historic South Central was a distant second with 80 accidents in 2019, up 5.3% from the year before. Bicycling collisions in Koreatown in 2019 were down 10% from 2018. (Crosstown)
Most Dangerous Intersections in Los Angeles
Crosstown also singled out the most dangerous intersections in L.A. according to accident rates. These places are hazardous not only for cyclists, but for other micromobility users, pedestrians, and motorists as well.
The worst crossroads is where Sepulveda Boulevard meets Sherman Way in Van Nuys. 16 lanes of traffic converge here. In 2019, LAPD documented 47 traffic collisions around the intersection.
The second worst intersection is Manchester Avenue and Figueroa Street in Vermont Knolls. The crossroads has an accident rate just under Sepulveda Boulevard/Sherman Way.
The third most dangerous crossroads is at Sepulveda and Burbank Boulevard, also in Van Nuys. The intersection saw 40 collisions in 2019.
Helmet Use in Los Angeles Bicycle Accidents
Bicyclists in California are not required to wear a helmet if they are 18-years-old or older. The National Safety Council estimates that helmet use reduces the risk of head injury by more than 50% for cyclists. When talking about preventing severe head injuries, the protective benefit is even higher.
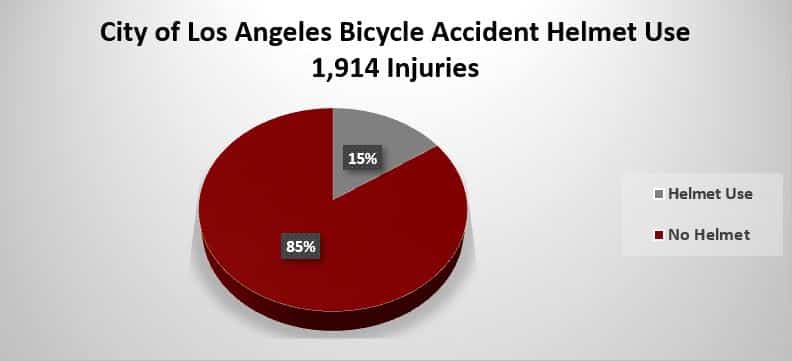
The California Highway Patrol (CHP) tracks helmet use in the bicycle accidents they respond to each year. In the City of Los Angeles in 2017, they tracked 1,914 bicycle accidents and found that 294 people in those accidents were wearing helmets, another 1,620 riders were not. In a tragic and telling statistic, they responded to 17 fatal bicycle accidents in 2017. None of those victims were found to be wearing safety equipment.
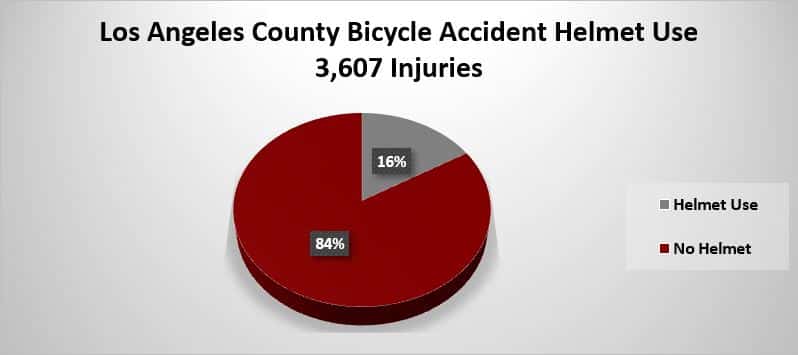
Here is a visual representation of helmet use in Los Angeles City and County. You’ll see that while Los Angeles County accounts for a much larger number of bicycle accidents, the percentage of helmet use is almost identical to the city’s percentage of usage. (CHP)
In 2017, The California Highway Patrol recorded around 3,607 bicycle accidents in the county. In those incidents where helmet use was recorded, 589 riders wore helmets. In the 38 reported deaths in bicycle accidents, none of the victims wore helmets.
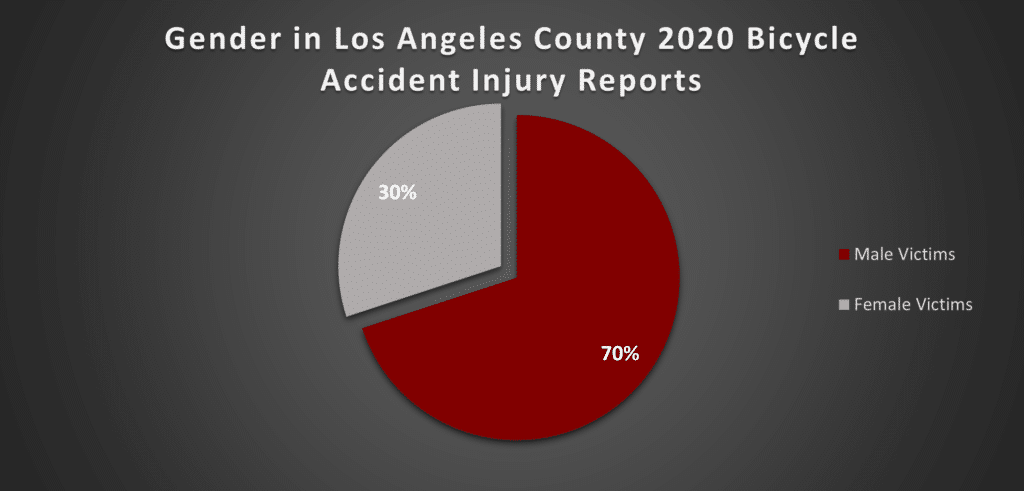
Gender and Age In Los Angeles County Bicycle Accidents
As is the case each year, more men than women were the victims of bicycle accidents in 2020. This is because there are more male riders than female riders taking to Los Angeles streets. In 2020 in Los Angeles County, roughly a third of victims were women. These figures don’t include bicycle accidents where the gender of victims was not reported to the TIMS.
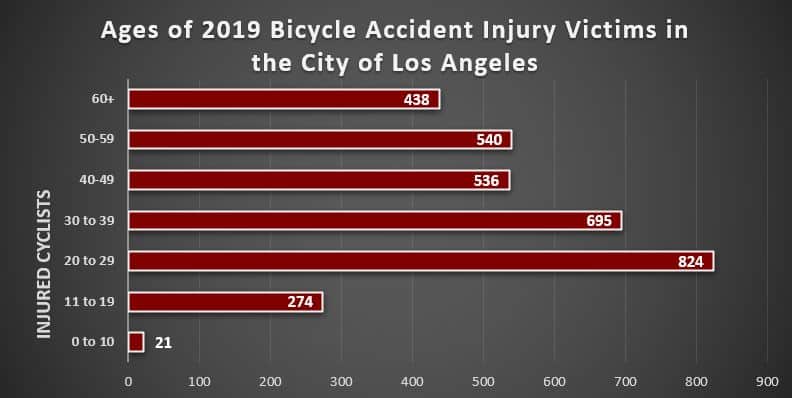
When the age of bicycle accident victims in the City of Los Angeles is totaled, it’s easy to see how injuries are spread out among the age groups and who is involved in the most collisions. Cyclists in their twenties appear to make up the majority of riders traveling city streets and therefore are the victims of the majority of crashes.
Staying Safe While Cycling In Los Angeles
At Maison Law, we want safer rides for every cyclist. We defend the right of bicyclists across Southern California and make sure drivers don’t escape the consequences for their careless and reckless acts.
We hope you are fortunate enough never to come in direct, physical contact with Los Angeles traffic, but if you or a loved one are in an accident caused by a careless driver, here are a few things to remember.
If you’re able, try to take photos of the accident scene, especially the damage to your bike and the vehicle involved. Get images of street and traffic signs. Take photos of any visible injuries. If you are unable to move about, ask someone with you or a helpful witness to take photos for you.
Make sure to get information from witnesses and look around for any possible security cameras that might have recorded what happened. Don’t throw out your damaged bike or any damaged clothing or personal property. They can all serve as evidence.
If you are ever hurt in a bicycle accident caused by a careless driver please feel free to contact us for a free consultation. Our goal is to support and protect victims through recovery and get them back on their bikes again as soon as possible.