The Support You Need.
The Settlement You Deserve.

California Auto Accident Statistics

California’s traffic problems are on display every day for residents. Even people who don’t live here know about the jam-packed freeways and reckless drivers who make the news. These issues can cause massive delays and lead to smashed bumpers. But a much more important consequence is all of the devastating injuries and deaths caused by preventable car accidents.

Maison Law of California thought it might be a good time to reflect on the most up-to-date car accident statistics. Our car collision study visualizes the most recent figures available in the hopes that drivers can more easily understand the enormous toll careless and reckless driving takes on our communities each year. It’s an important review that might keep drivers from repeating the same dangerous mistakes as we all try to travel through 2026 and beyond safely.

California Serious and Fatal Accidents

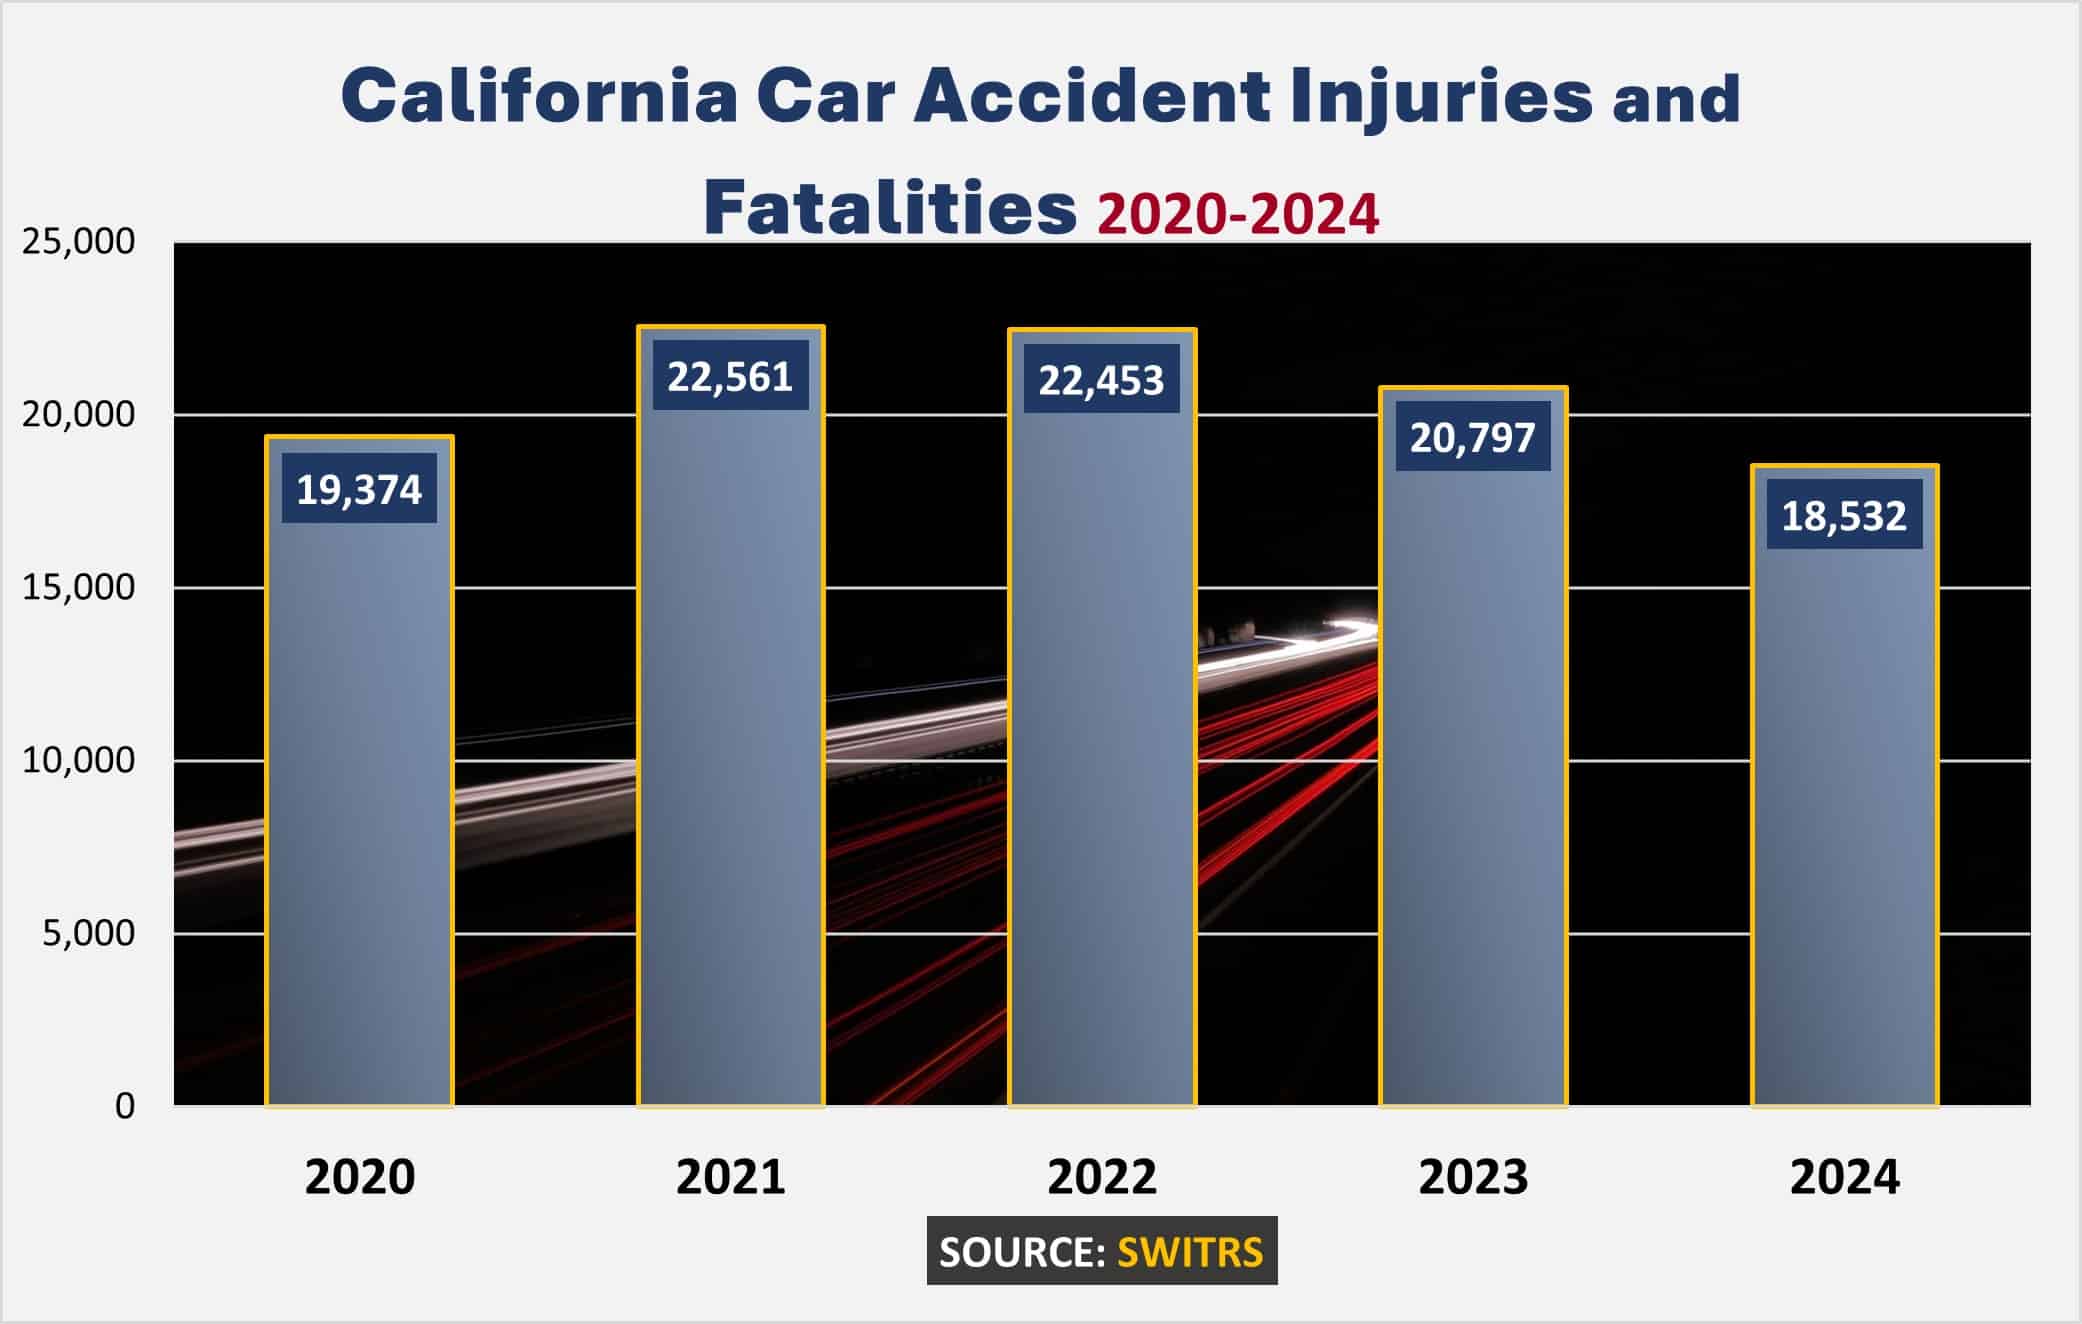
California’s major accident numbers for 2024 showed a slight decline in cases from 2023, but that was one of the few positive notes. However, 2024 statistics can change as more data gets added by law enforcement from across the country. Overall, in the past few years, accident rates have veered into extreme territory not seen in a decade or more.

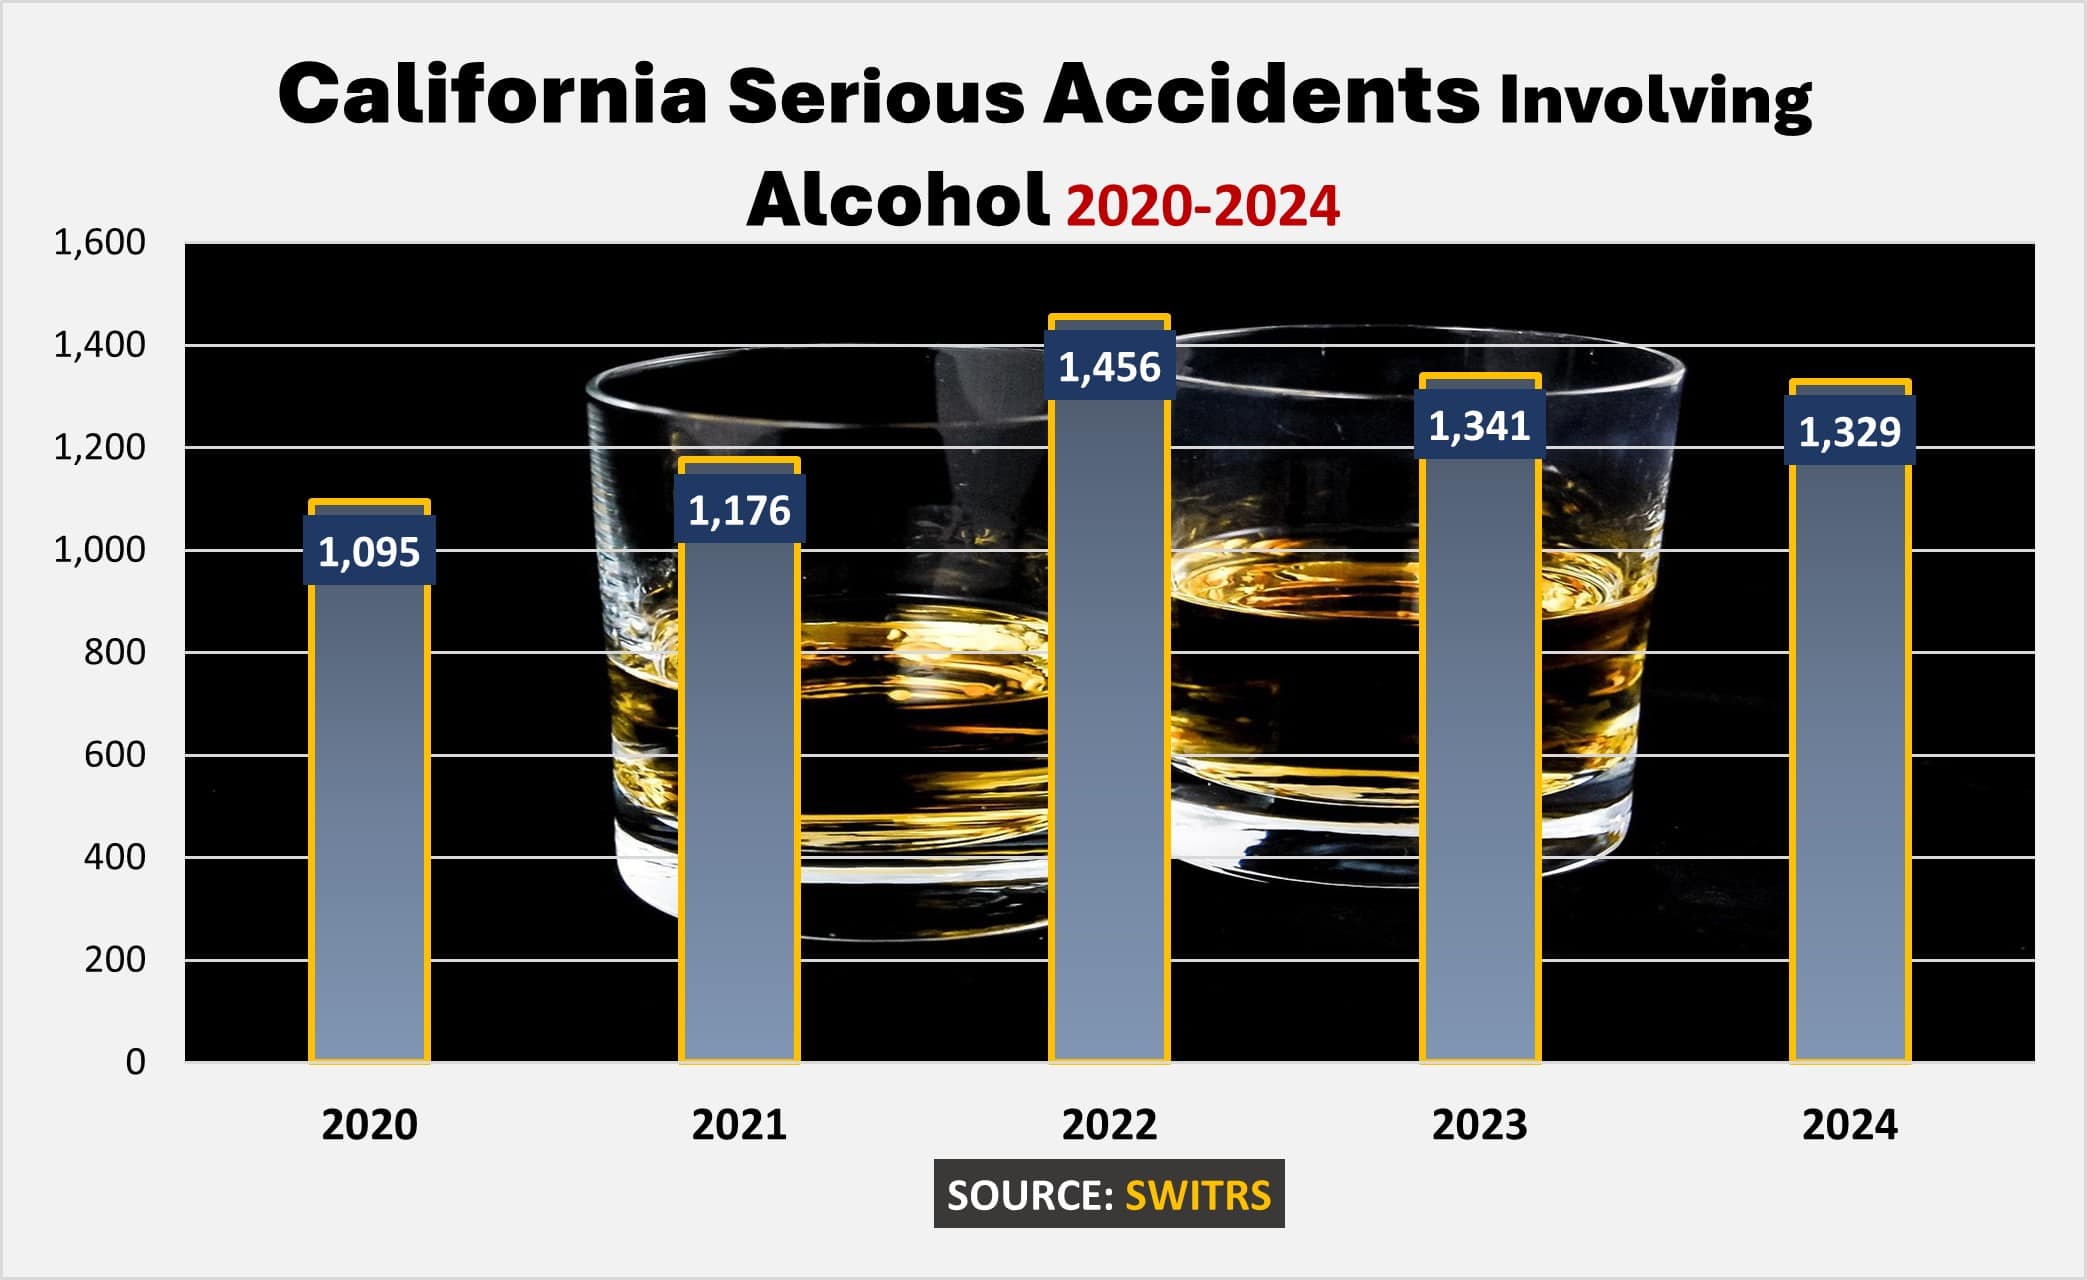
The California Statewide Integrated Traffic Records System (SWITRS) shows that 2024 continued the trend of highly elevated serious accident numbers. This chart shows the shocking number of accidents involving a serious injury or fatality in recent years:

California recorded at least 18,532 traffic accidents involving serious injuries or deaths in 2024. That preliminary number is down from 2023's 20,797 serious accidents and 2022's shocking 22,453 collisions.

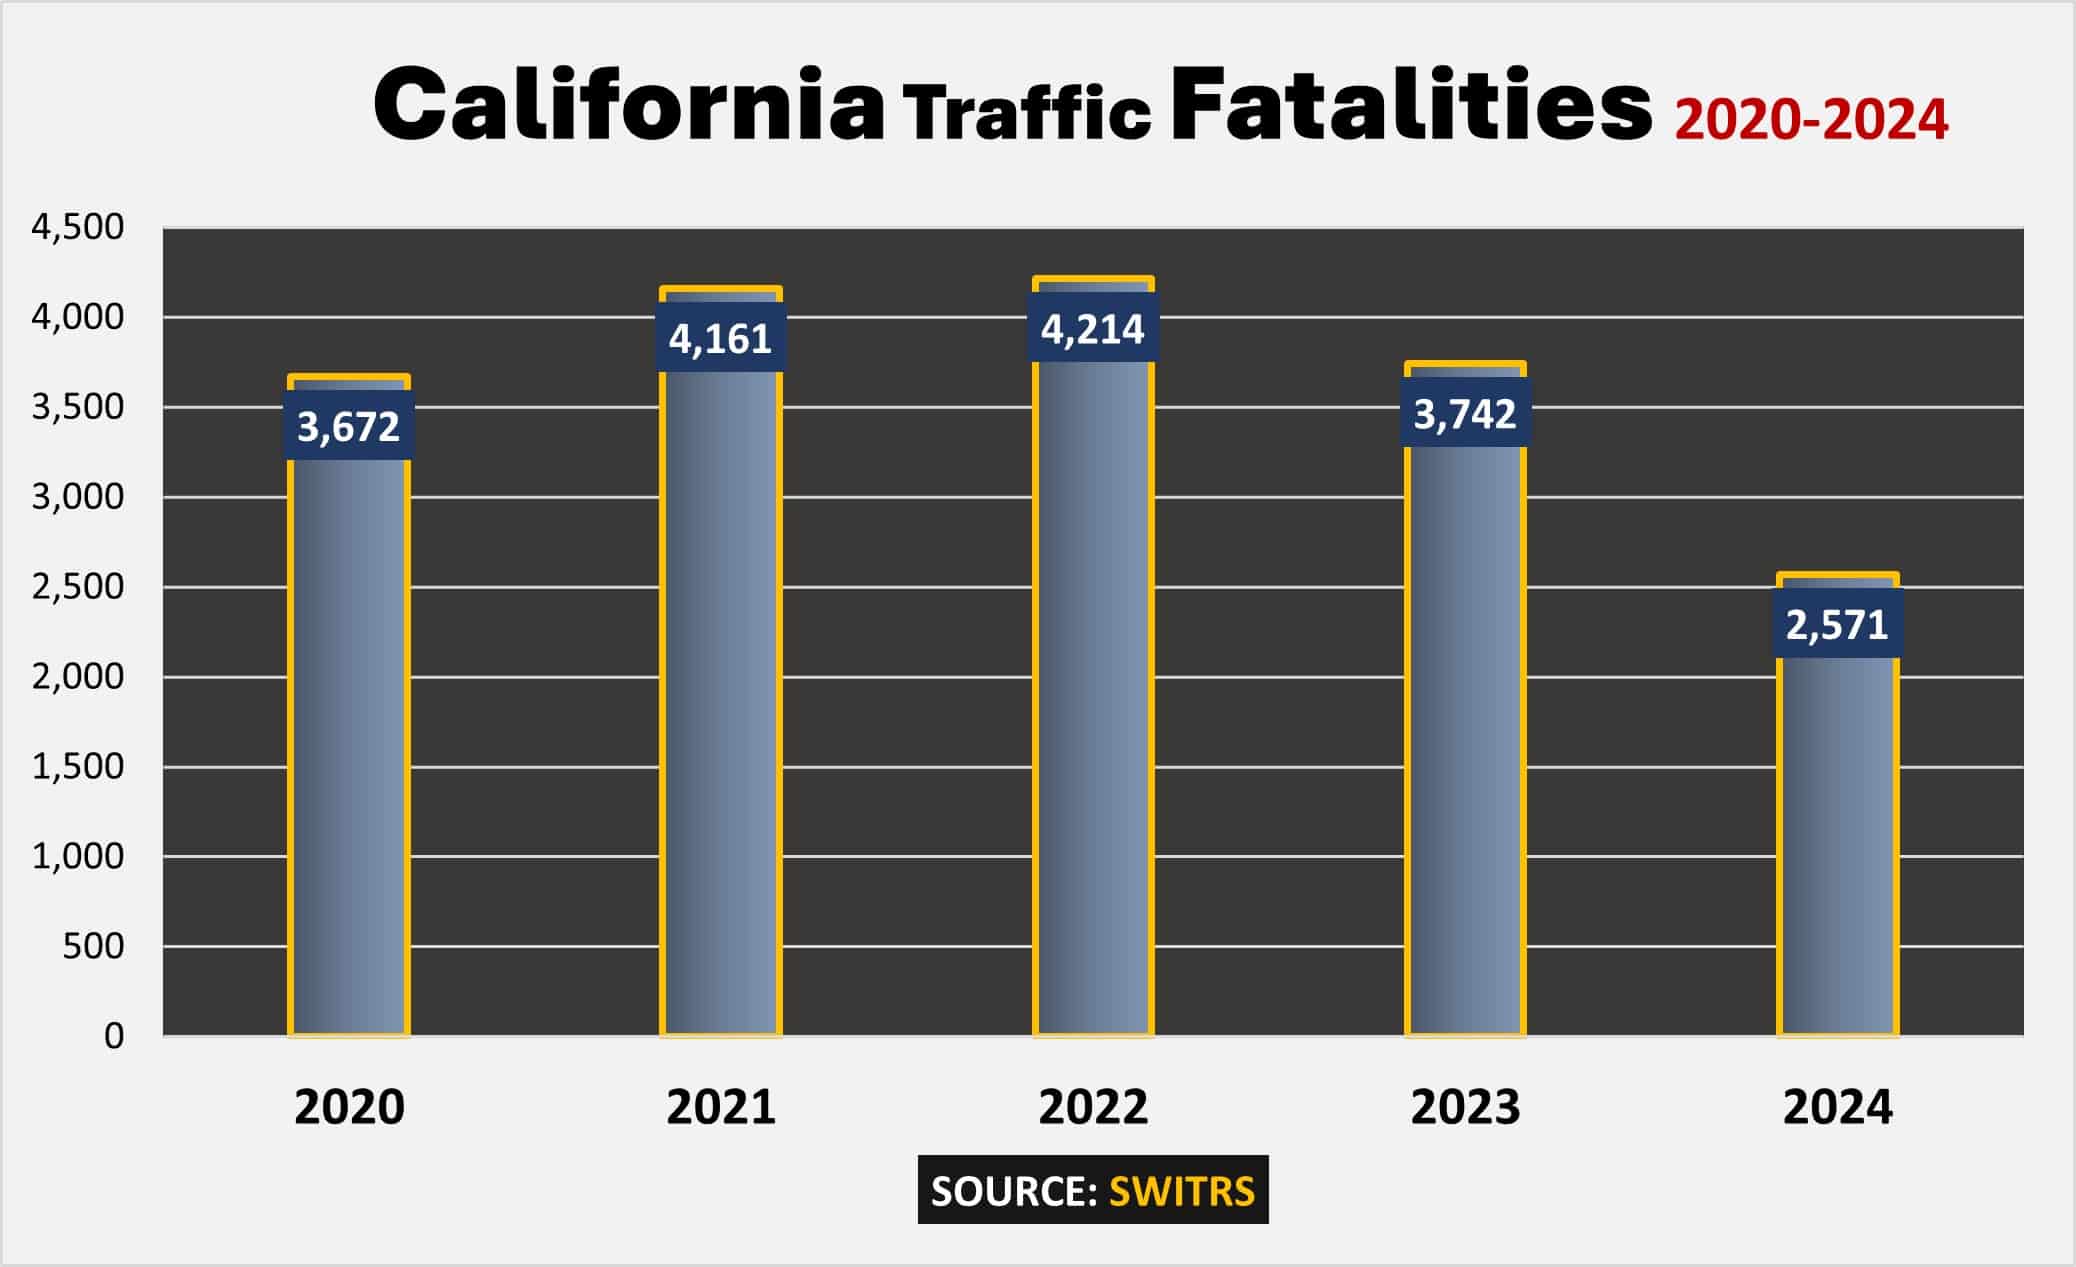
SWITRS deadly accident figures also show that preliminary 2024 California fatal figures remain high and may grow as the reporting of accident data continues in 2025. In 2024, California documented at least 2,571 deaths on local roadways.

California recorded 2,571 fatal accidents in preliminary figures from 2024. That was down from 3,742 lost lives in 2023 and 4,214 deaths in 2022.

California’s Most Dangerous Cities for Car Crashes in 2026

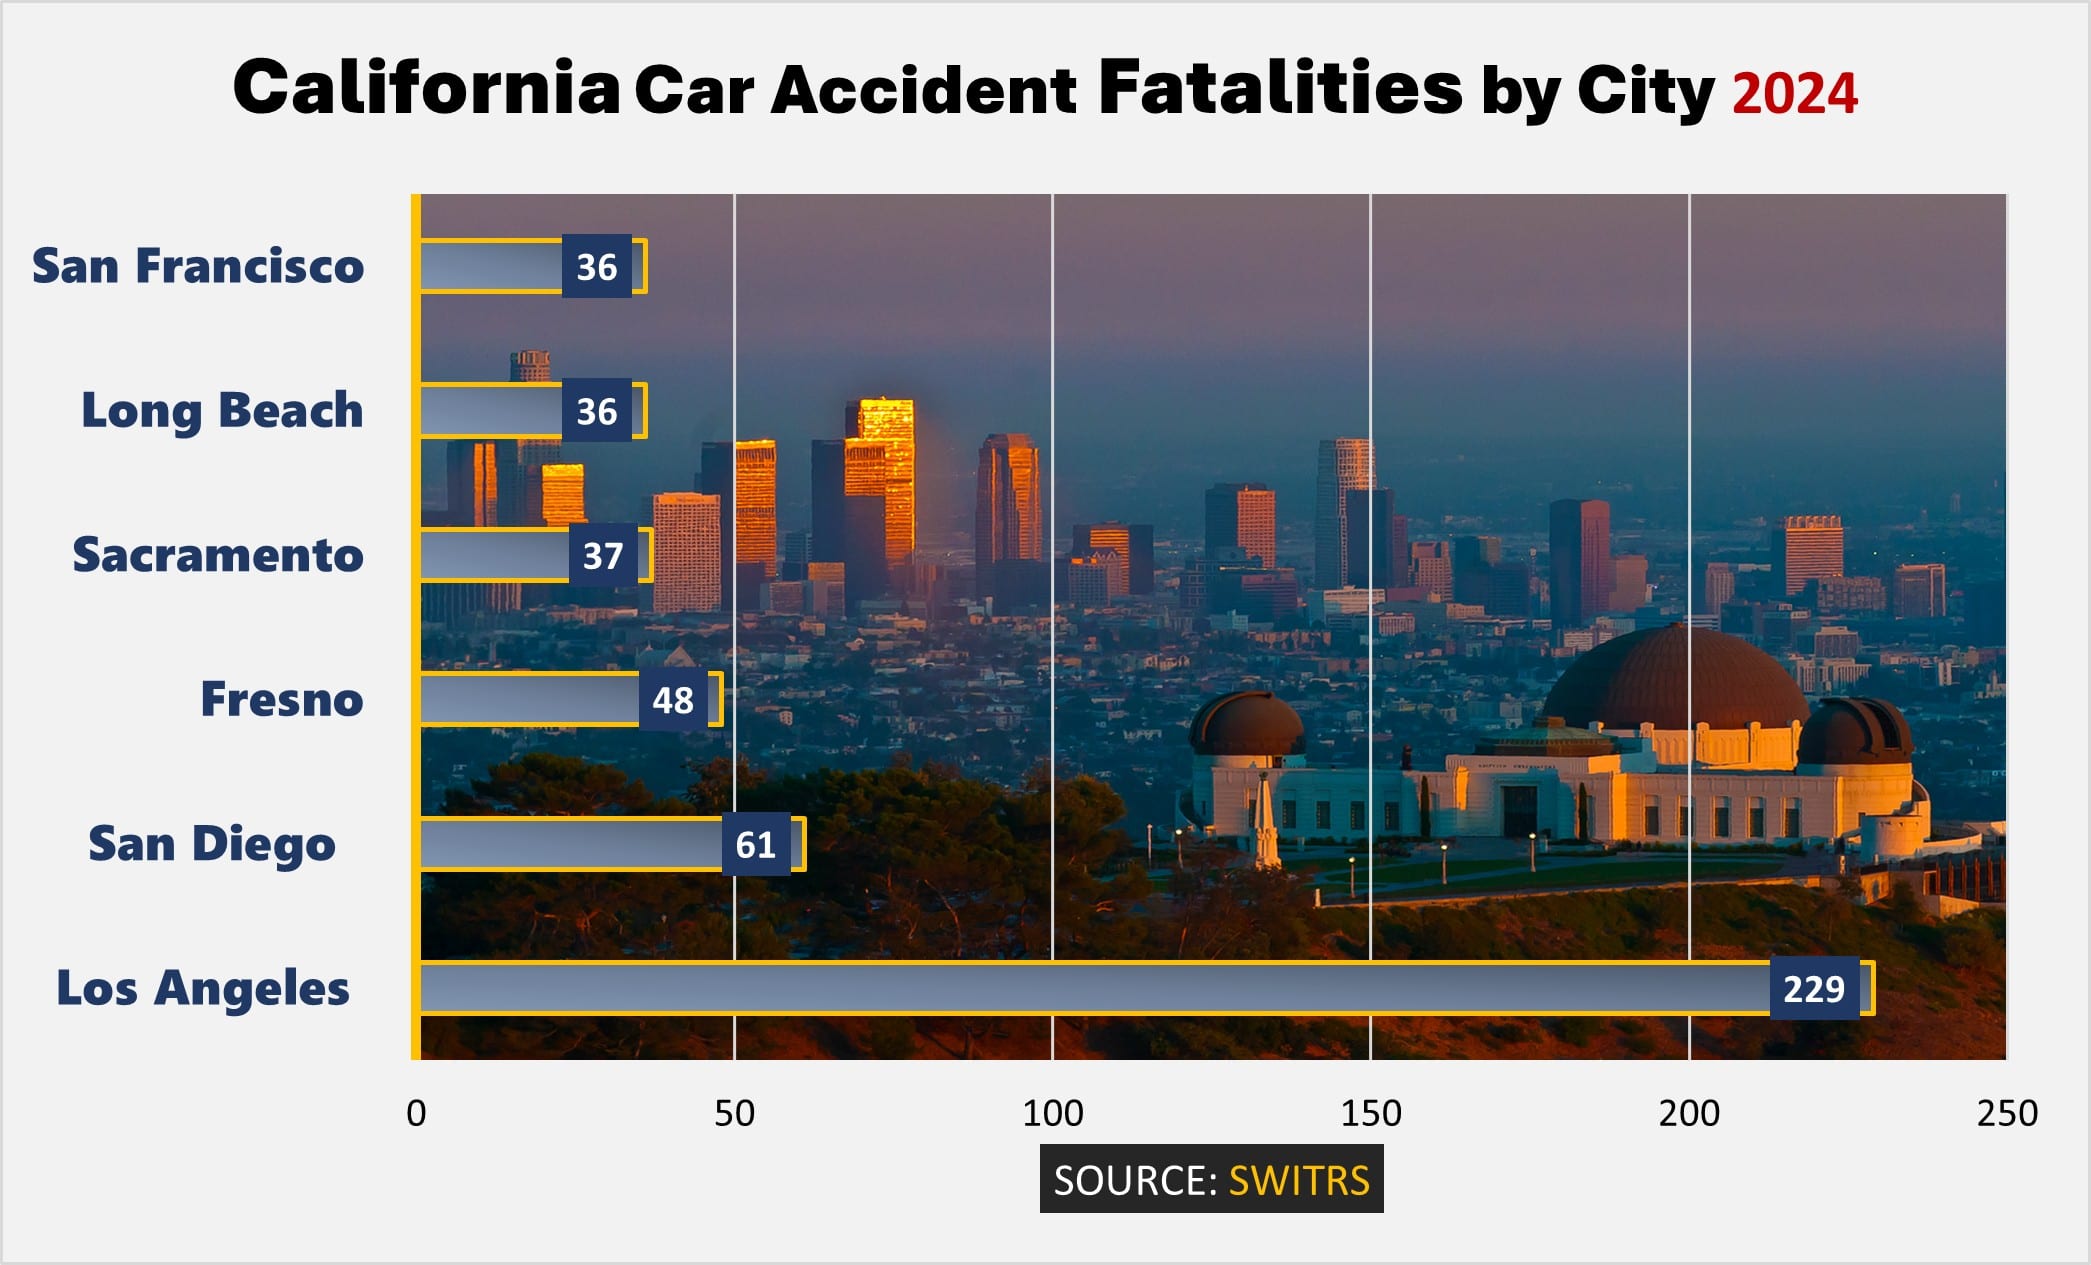
Los Angeles is the city that makes headlines for crazy drivers and traffic nightmares. It’s no surprise that it’s the biggest contributor to California’s annual accident statistics. L.A. and Los Angeles County record around 19% of the state’s reported fatalities each year.

Los Angeles led the way, but there are plenty of dangerous urban sprawls that California residents must drive across each day. SWITRS data highlights the places you’re most likely to get into a deadly accident:

Los Angeles recorded the most fatal accidents of any city in California with 229 tragic deaths in 2024. San Diego had 61 lives lost. Fresno had 48 fatalities. Sacramento saw 37 fatalities. Long Beach recorded 36 fatalities. San Francisco recorded 36 fatalities.

California Drunk Driving Accident Statistics

Getting behind the wheel after drinking or taking drugs is the most reckless decision California drivers can make. These decisions continue to lead to devastating accidents that cause injury and the loss of life on California streets.

Accidents caused by DUI drivers involving injury and fatalities in the state stayed at the same extreme levels from 2023 to 2024, and that means the number of motorists who drive while intoxicated remains unbelievably high. According to SWITRS, in 2024, there were over 1,329 accidents involving serious injuries or fatalities by drivers under the influence of alcohol.

In 2024, California recorded 1,329 serious alcohol-related accidents (accidents involving a serious injury or a fatality). In 2023, there were 1,341 similar accidents. In 2022, there were 1,456 similar collisions.

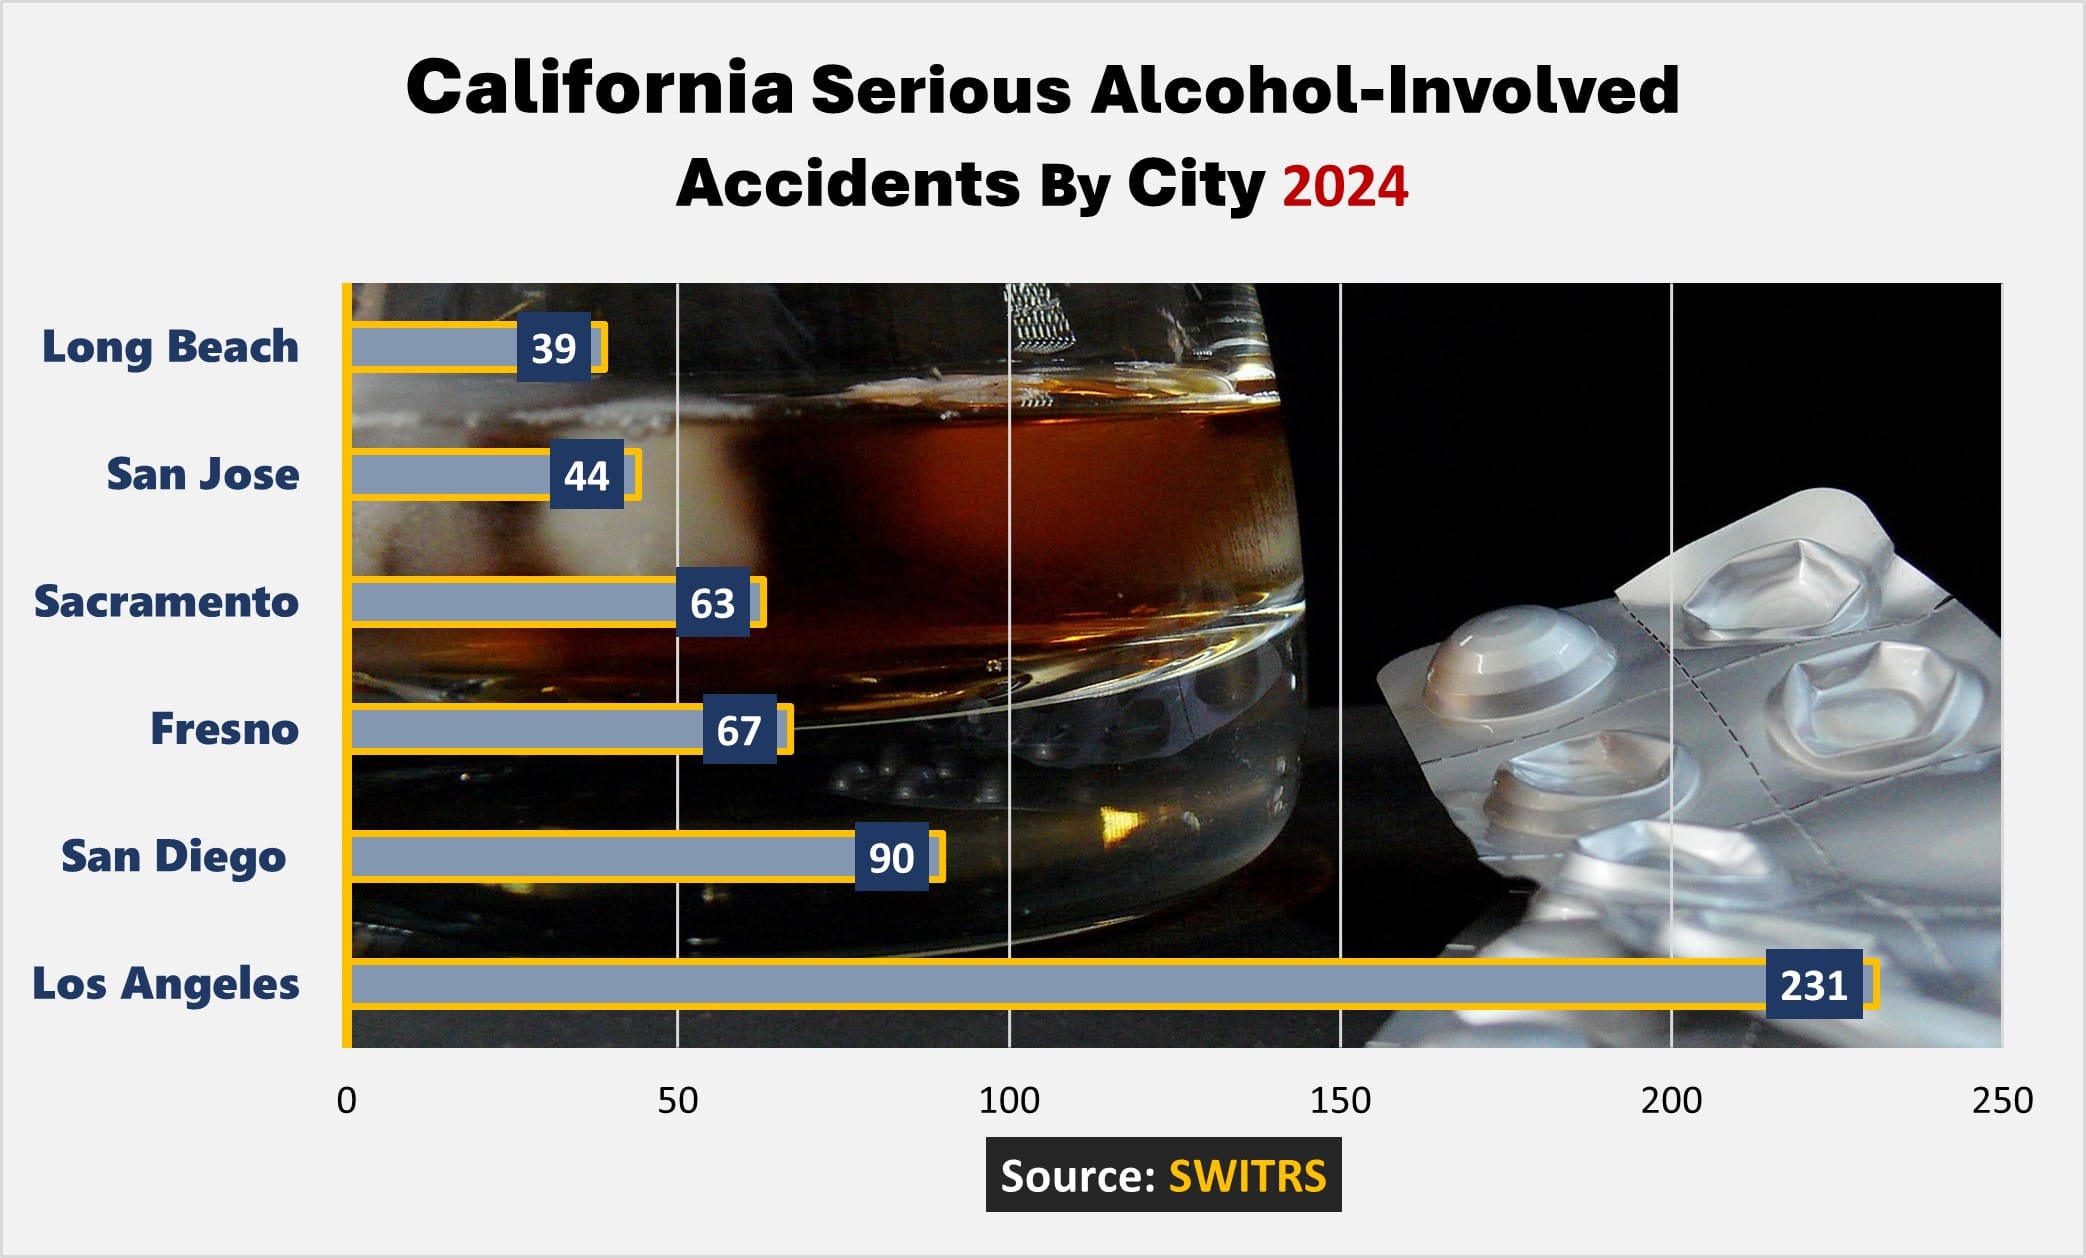
Among California cities, Los Angeles continued to lead the state in alcohol-related accidents in 2024. Below is a visual representation of the cities with the most accidents involving drivers impaired by alcohol. The data highlights any alcohol-involved accident resulting in accidents leading to serious injuries or death.

Los Angeles was the California city with the most alcohol-related accidents involving a serious injury or a fatality with 231 incidents. San Diego was second with 90 serious collisions. Fresno had 67 incidents. Sacramento had 63 such accidents. San Jose had 44 accidents. Long Beach had 39 accidents.

Distracted Driver Dangers on California Freeways

Distracted driving continues to be a dangerous factor in all travel across California. So many accidents could be prevented if motorists would focus on the lanes and stop allowing their attention to be led astray. A glance at a text, a conversation with a passenger, or even a change of the radio dial can all cause a driver to miss a traffic slowdown ahead, or a light changing to red.

Of course, staring at a cell phone is the number one distraction for drivers in this day and age. The California Highway Patrol (CHP) reports that looking at a cell phone increases your chance of an accident by 400%. There are plenty of reasons to avoid holding or looking at a cell phone screen. It’s against the law and it’s dangerous. There’s also a financial penalty. The CHP confirms that a first offense of texting while driving will cost drivers a minimum of a $162 fine in addition to court fees.

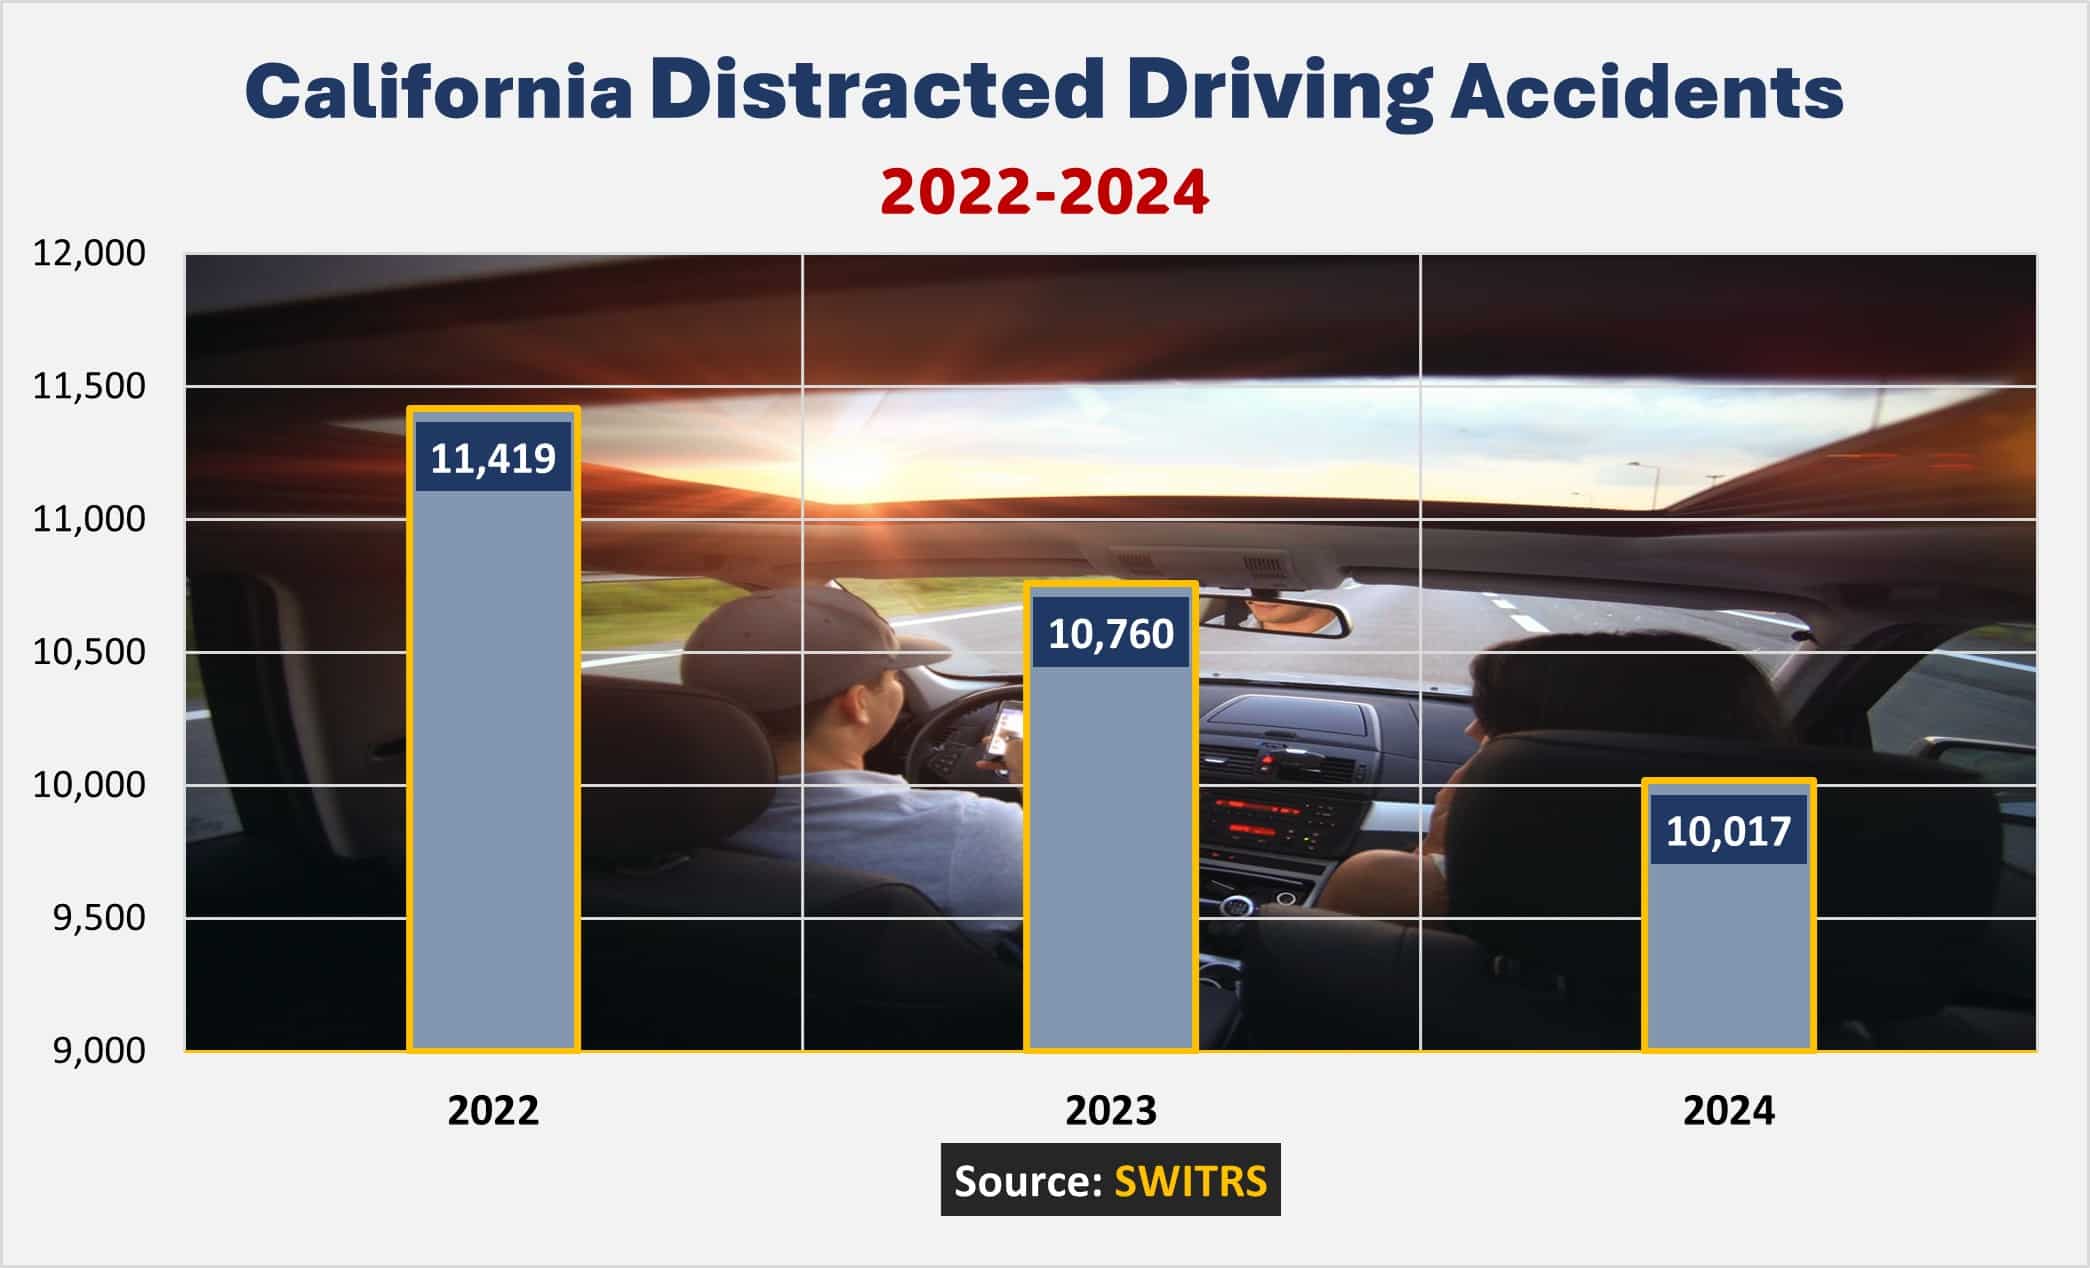
SWITRS data show that despite social media and TV campaigns, far too many drivers are still flying down the road while distracted. These figures show the distracted driving accidents that caused any sort of injury in 2024 and over the past few years.

California's preliminary number for 2024 distracted driving accidents stands at 10,017. These were accidents that involved any level of injury. In 2023, there were 10,760 accidents involving distracted drivers. 2022 brought with it 11,419 such incidents.

More Information on California’s Texting and Driving Laws

The Disturbing Accident Trends Across the United States

California is near the top of yearly national lists for the most dangerous states to drive in.

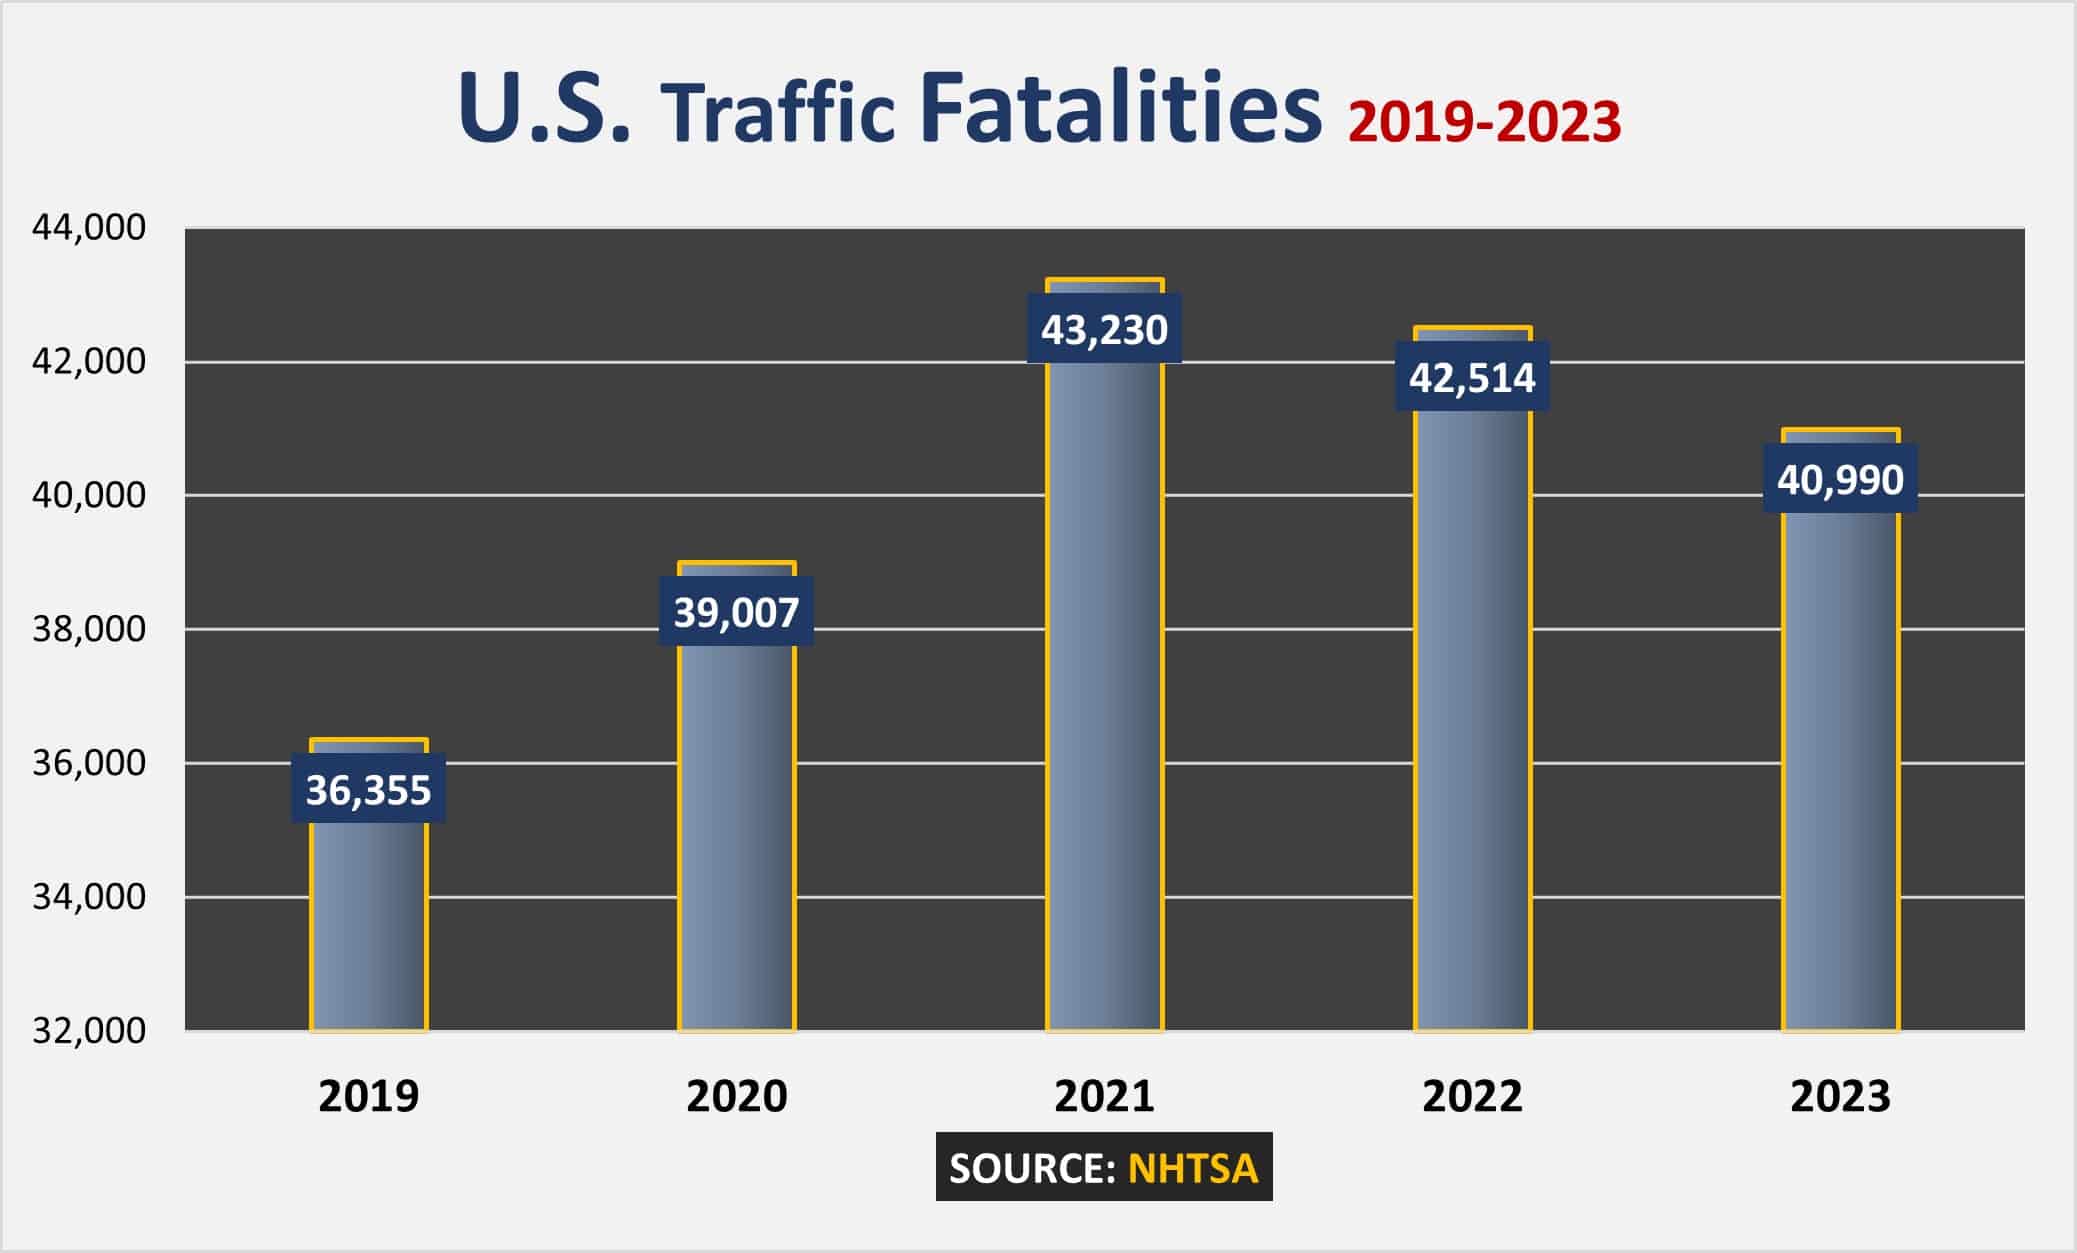
The National Highway Traffic Safety Administration (NHTSA) estimates that almost 40,990 people tragically lost their lives on America’s roadways in 2023. That was down about 3.6% from 2022 figures. We await the release of official 2024 accident numbers to see if any improvements were seen on our nation’s highways.

Each year, too many people suffer major injuries and lose their lives to careless accidents. This is a look at fatal accident figures in the United States over the most recent five-year span for which data is available from the NHTSA:

The NHTSA found that there were around 40,990 deaths on U.S. roads in 2023. That was down from 2022's 42,514 fatalities.

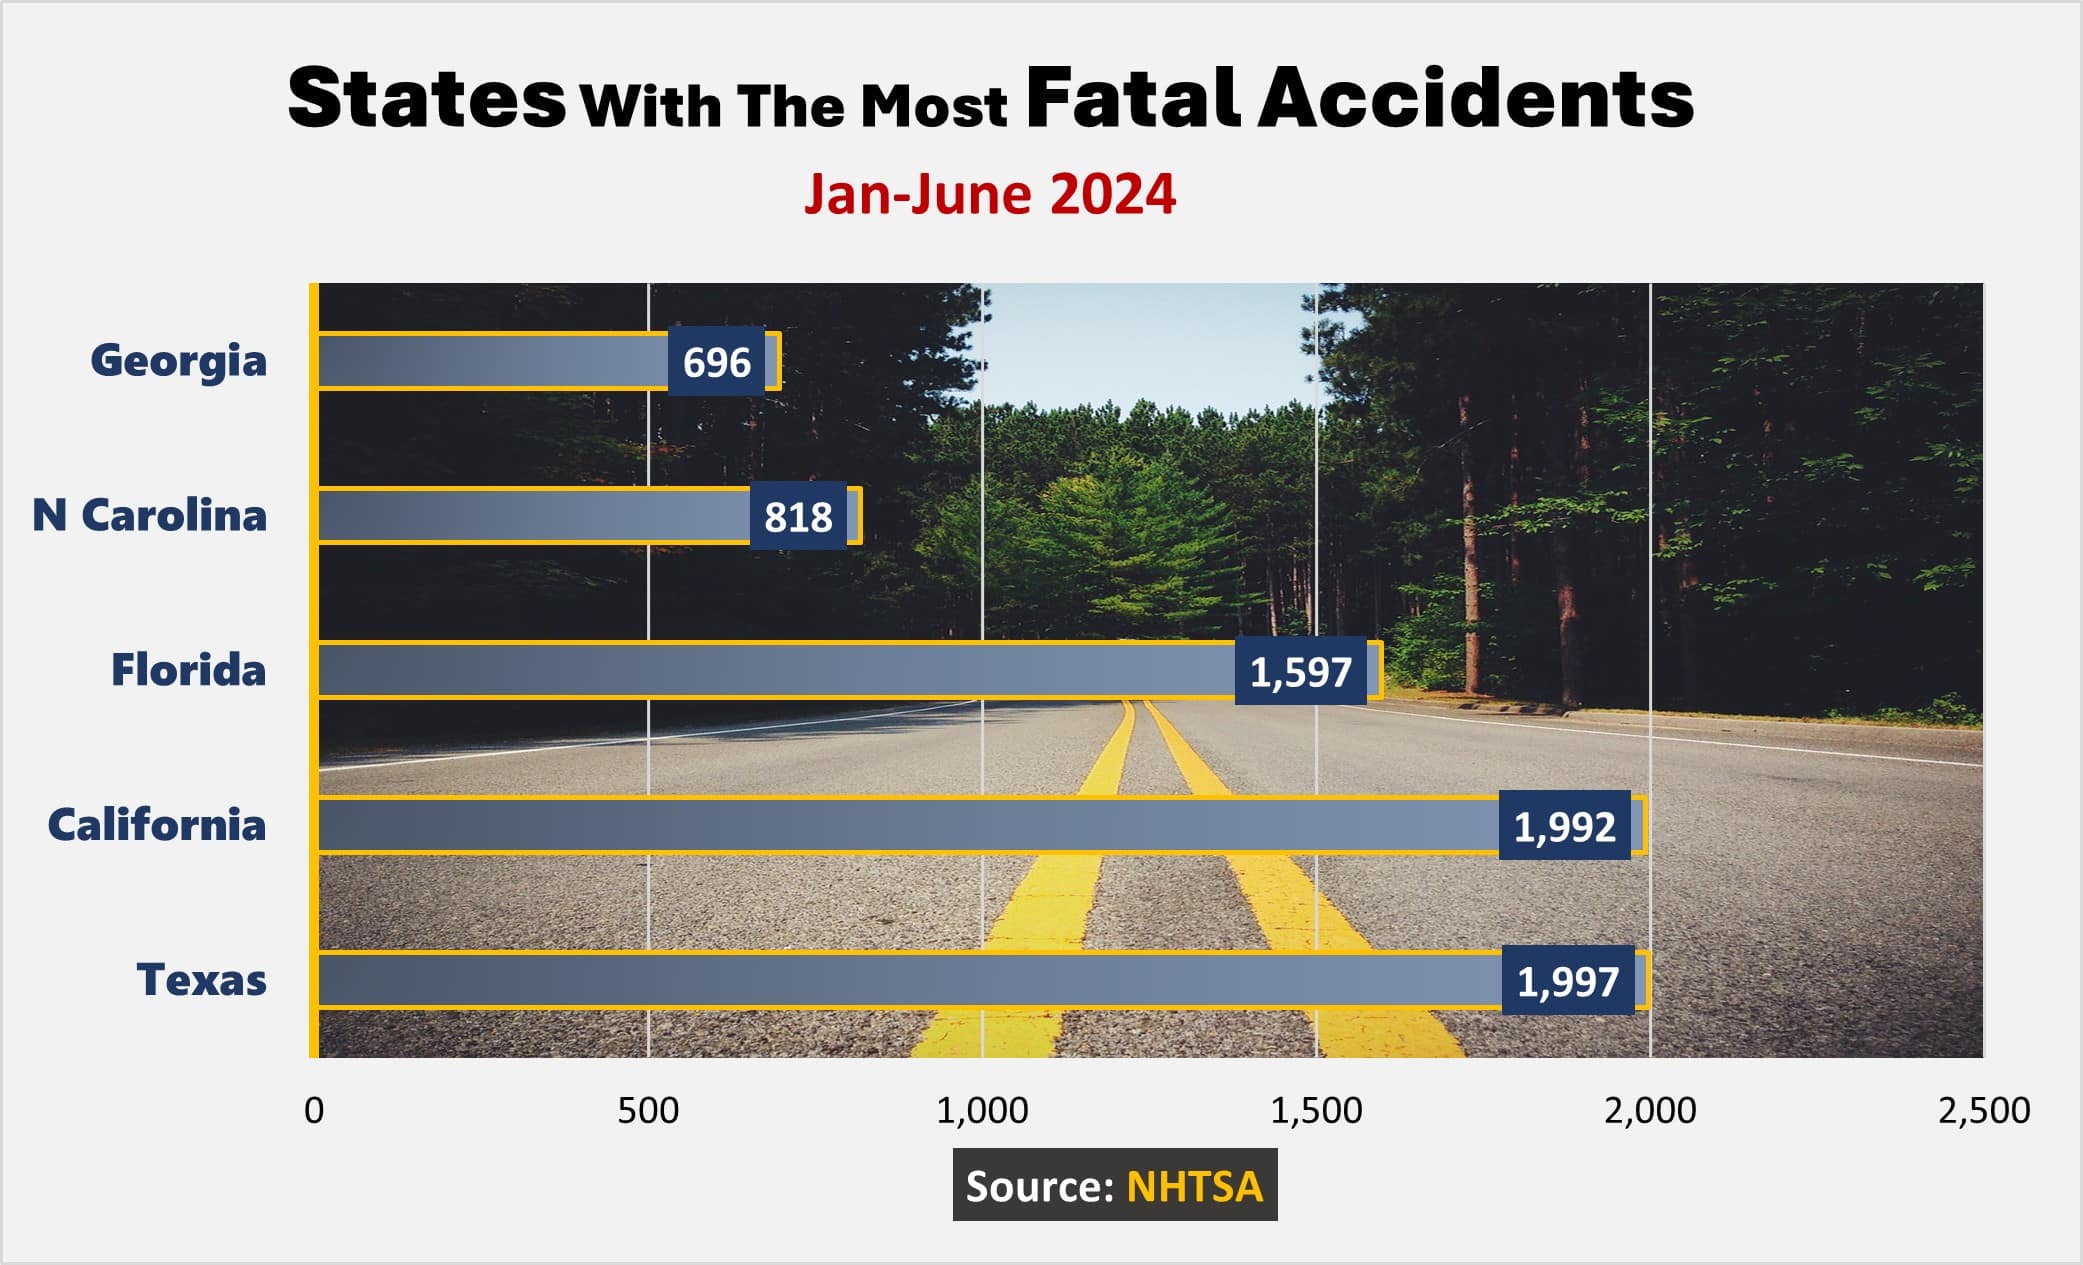
When zooming down to a state-level statistical analysis, Texas and California are always neck and neck for the unwanted distinction of being the deadliest state for motorists. Florida follows closely behind each year.

An NHTSA early estimate for crash rates in the first half of 2024 (Jan-June) on state-level fatal accidents showed that the tragic pattern held. The top 2 states for deadly highway accidents didn’t change from 2022 to 2023. California stayed just shy of Texas’s totals across both years. First half of the year deadly incidents for California in 2024 were .03% higher than accidents recorded in the first half of 2023.

Texas recorded 1,997 lives lost in accidents in the first half of 2024 (January-June). California was just behind with 1,992 fatalities. Florida documented 1,597 fatalities.

The Most Dangerous Cities for Drivers in San Joaquin Valley and South Central Valley

Now that we’ve covered California’s statewide stats, let’s take a look at the cities in our own region—the San Joaquin Valley and Central Valley South.

When it comes to overall traffic safety, Bakersfield ranks as one of the worst, according to the California Office of Traffic Safety. In 2023, the most recent data year available, Bakersfield ranked 4th most dangerous among the 15 cities of similar size in California. The main factors contributing to that ranking include 238 hit-and-run collisions, 340 crashes in which alcohol was involved, 199 speed-related collisions, and 216 nighttime accidents, all contributing to a staggering total of 2,073 fatalities and injuries.

Other South Central Valley and San Joaquin Valley cities worth noting for their relatively high rate of car accidents include Taft, Porterville, Stockton and Modesto.

See how other cities in the region stack up in the table below. 

City Population (Avg.) OTS Population Group Total Fatalities & Injuries Overall Traffic Safety Ranking
Bakersfield 414,451 A 2,073 4 / 15
Stockton 323,355 A 1,913 5 / 15
Fresno 552,751 A 1,600 13 / 15
Modesto 219,705 B 1,876 9 / 62
Visalia 145,970 B 495 40 / 62
Clovis 127,674 B 395 57 / 62
Porterville 63,603 C 385 2 / 103
Turlock 71,997 C 399 21 / 103
Merced 93,138 C 429 23 / 103
Madera 67,013 C 192 30 / 103
Hanford 59,856 C 201 47 / 103
Delano 52,966 C 136 55 / 103
Manteca 92,116 C 221 67 / 103
Lodi 67,262 C 190 71 / 103
Tracy 97,501 C 223 82 / 103
Tulare 71,557 C 82 85 / 103
Atwater 31,921 D 111 11 / 93
Lathrop 37,102 D 148 14 / 93
Riverbank 25,290 D 106 15 / 93
Los Banos 48,213 D 221 22 / 93
Ceres 49,480 D 241 26 / 93
Wasco 27,221 D 43 38 / 93
Dinuba 25,852 D 59 45 / 93
Reedley 25,950 D 42 59 / 93
Lemoore 27,122 D 53 60 / 93
Sanger 26,652 D 50 65 / 93
Ridgecrest 28,307 D 83 72 / 93
Oakdale 23,167 E 69 9 / 103
Lindsay 12,734 E 62 17 / 103
Arvin 19,796 E 53 30 / 103
California City 13,189 E 43 37 / 103
Chowchilla 19,123 E 36 43 / 103
Selma 24,487 E 62 47 / 103
Tehachapi 11,122 E 19 49 / 103
Corcoran 21,765 E 58 51 / 103
Patterson 24,977 E 51 54 / 103
Ripon 15,966 E 16 55 / 103
Shafter 22,399 E 55 56 / 103
Livingston 14,451 E 33 57 / 103
Newman 12,260 E 14 60 / 103
Kerman 17,403 E 22 62 / 103
Exeter 10,252 E 8 70 / 103
Kingsburg 13,167 E 19 73 / 103
Parlier 14,535 E 10 80 / 103
Farmersville 10,422 E 22 82 / 103
Mendota 12,598 E 13 86 / 103
Avenal 14,065 E 4 90 / 103
McFarland 13,902 E 0 96 / 103
Coalinga 17,252 E 2 99 / 103
Taft 7,089 F 40 1 / 74
Gustine 6,035 F 15 14 / 74
Dos Palos 5,728 F 6 30 / 74
San Joaquin 3,653 F 0 37 / 74
Escalon 7,337 F 28 40 / 74
Waterford 9,161 F 20 41 / 74
Hughson 7,801 F 24 43 / 74
Huron 6,421 F 0 49 / 74
Woodlake 7,793 F 5 56 / 74
Fowler 7,436 F 0 68 / 74
Firebaugh 8,510 F 0 68 / 74
Orange Cove 9,622 F 0 73 / 74
Maricopa 1,018 G 0 14 / 32

The “overall traffic safety rankings” above are based on an aggregate of the following types of car accidents: alcohol-related, hit and run, speed-related, and nighttime. Cities are grouped by population size. Each ranking consists of two numbers—the first being the city’s rank, and the second being the total number of cities in that population group. A ranking of 1 is considered the highest or worst. You can find more information about these rankings on the California Office of Traffic Safety website

Hope for a Safer 2026 on California Freeways

With the discouraging traffic outlook for California, it’s critical that every motorist commits to safer behavior on local roads. It’s the only way to improve 2026 figures and to give motorists, pedestrians, and cyclists a better chance of making it home safely. Added attention to the road and to speeds are some of the few changes that will make a real difference in the tragic accident numbers tallied across our state and within our cities each year.

If you or a loved one becomes the victim of a driver’s carelessness, don’t wait to seek legal help. Take advantage of a free consultation with a California Car Accident Lawyer to find out what you should be demanding in recovery support. Maison Law works with accident victims and their families to make sure insurance companies provide them with everything they need to rebuild their health and their lives.