
Halloween lands on a Saturday this year. Kids will fill the sidewalks, parents will walk beside them, and drivers will head to parties on the same streets.
In the last three Halloween seasons, California cities recorded more than 37,000 fatal and injury crashes between October 1 and the first days of November. Those crashes did not spread evenly.
Maison Law ranked 336 California cities on Halloween safety. We scored each city on seasonal crashes, alcohol-involved crashes, pedestrian crashes, long-term crash rates and October reported crime.
Signal Hill ranks as the most dangerous city, followed by Beverly Hills and Malibu. Five of the ten highest scores belong to Los Angeles County cities. At the other end, Canyon Lake, Clayton and Rancho Santa Margarita score lowest. Signal Hill scores 74.99, while Canyon Lake scores 1.01.
These scores compare cities with each other. They show where conditions around Halloween look riskiest and where they look calmest.
The analysis draws on crash and crime records from the last three Halloween seasons and annual crash counts for 2021 through 2025. All five measures receive equal weight.
These rankings describe relative safety conditions during the broader Halloween season and year-round background conditions. They do not measure a person’s chance of being injured on Halloween night or establish which individual neighborhoods are safest for trick-or-treating.
Key takeaways
- Signal Hill, Beverly Hills and Malibu have the highest overall Danger Scores. Canyon Lake, Clayton and Rancho Santa Margarita have the lowest.
- Five of the ten highest-scoring cities are in Los Angeles County: Signal Hill, Beverly Hills, Malibu, West Hollywood and El Segundo.
- Signal Hill has the highest seasonal crash rate and long-term annual crash rate among the ranked cities.
- Central Valley cities appear at both ends of the list. Modesto ranks 17th most dangerous and Turlock 35th, while Newman, Reedley and Sanger rank among the safest 25.
- All five factors receive equal weight. Scores compare cities with complete, internally consistent data and populations of at least 10,000, subject to the exclusions explained below.
- Of the 40 cities with 10,000 or more residents that are not ranked, 36 have missing or incomplete records, two are excluded as industrial cities and two have counts we could not verify. Each is listed with its reason at the end of this report.
The most dangerous California cities for Halloween
Signal Hill leads the index with a Danger Score of 74.99. Its mean seasonal fatal and injury crash rate is 162.72 per 100,000 residents, and its long-term average annual crash rate is 1,344.63 per 100,000. Both are the highest among the ranked cities. Those measures count collisions rather than the number of people killed or injured.
Beverly Hills ranks second with a score of 72.17. Its mean seasonal crash rate is 134.42 per 100,000, and its pedestrian-involved crash rate is 13.44. Malibu ranks third at 57.26, driven by the highest alcohol-involved seasonal crash rate among the ranked cities, 15.58 per 100,000.
The factors do not produce identical rankings. West Hollywood has the highest pedestrian-involved seasonal rate, and Emeryville has the highest October reported crime rate among the ranked cities. Their overall positions reflect all five measures together.
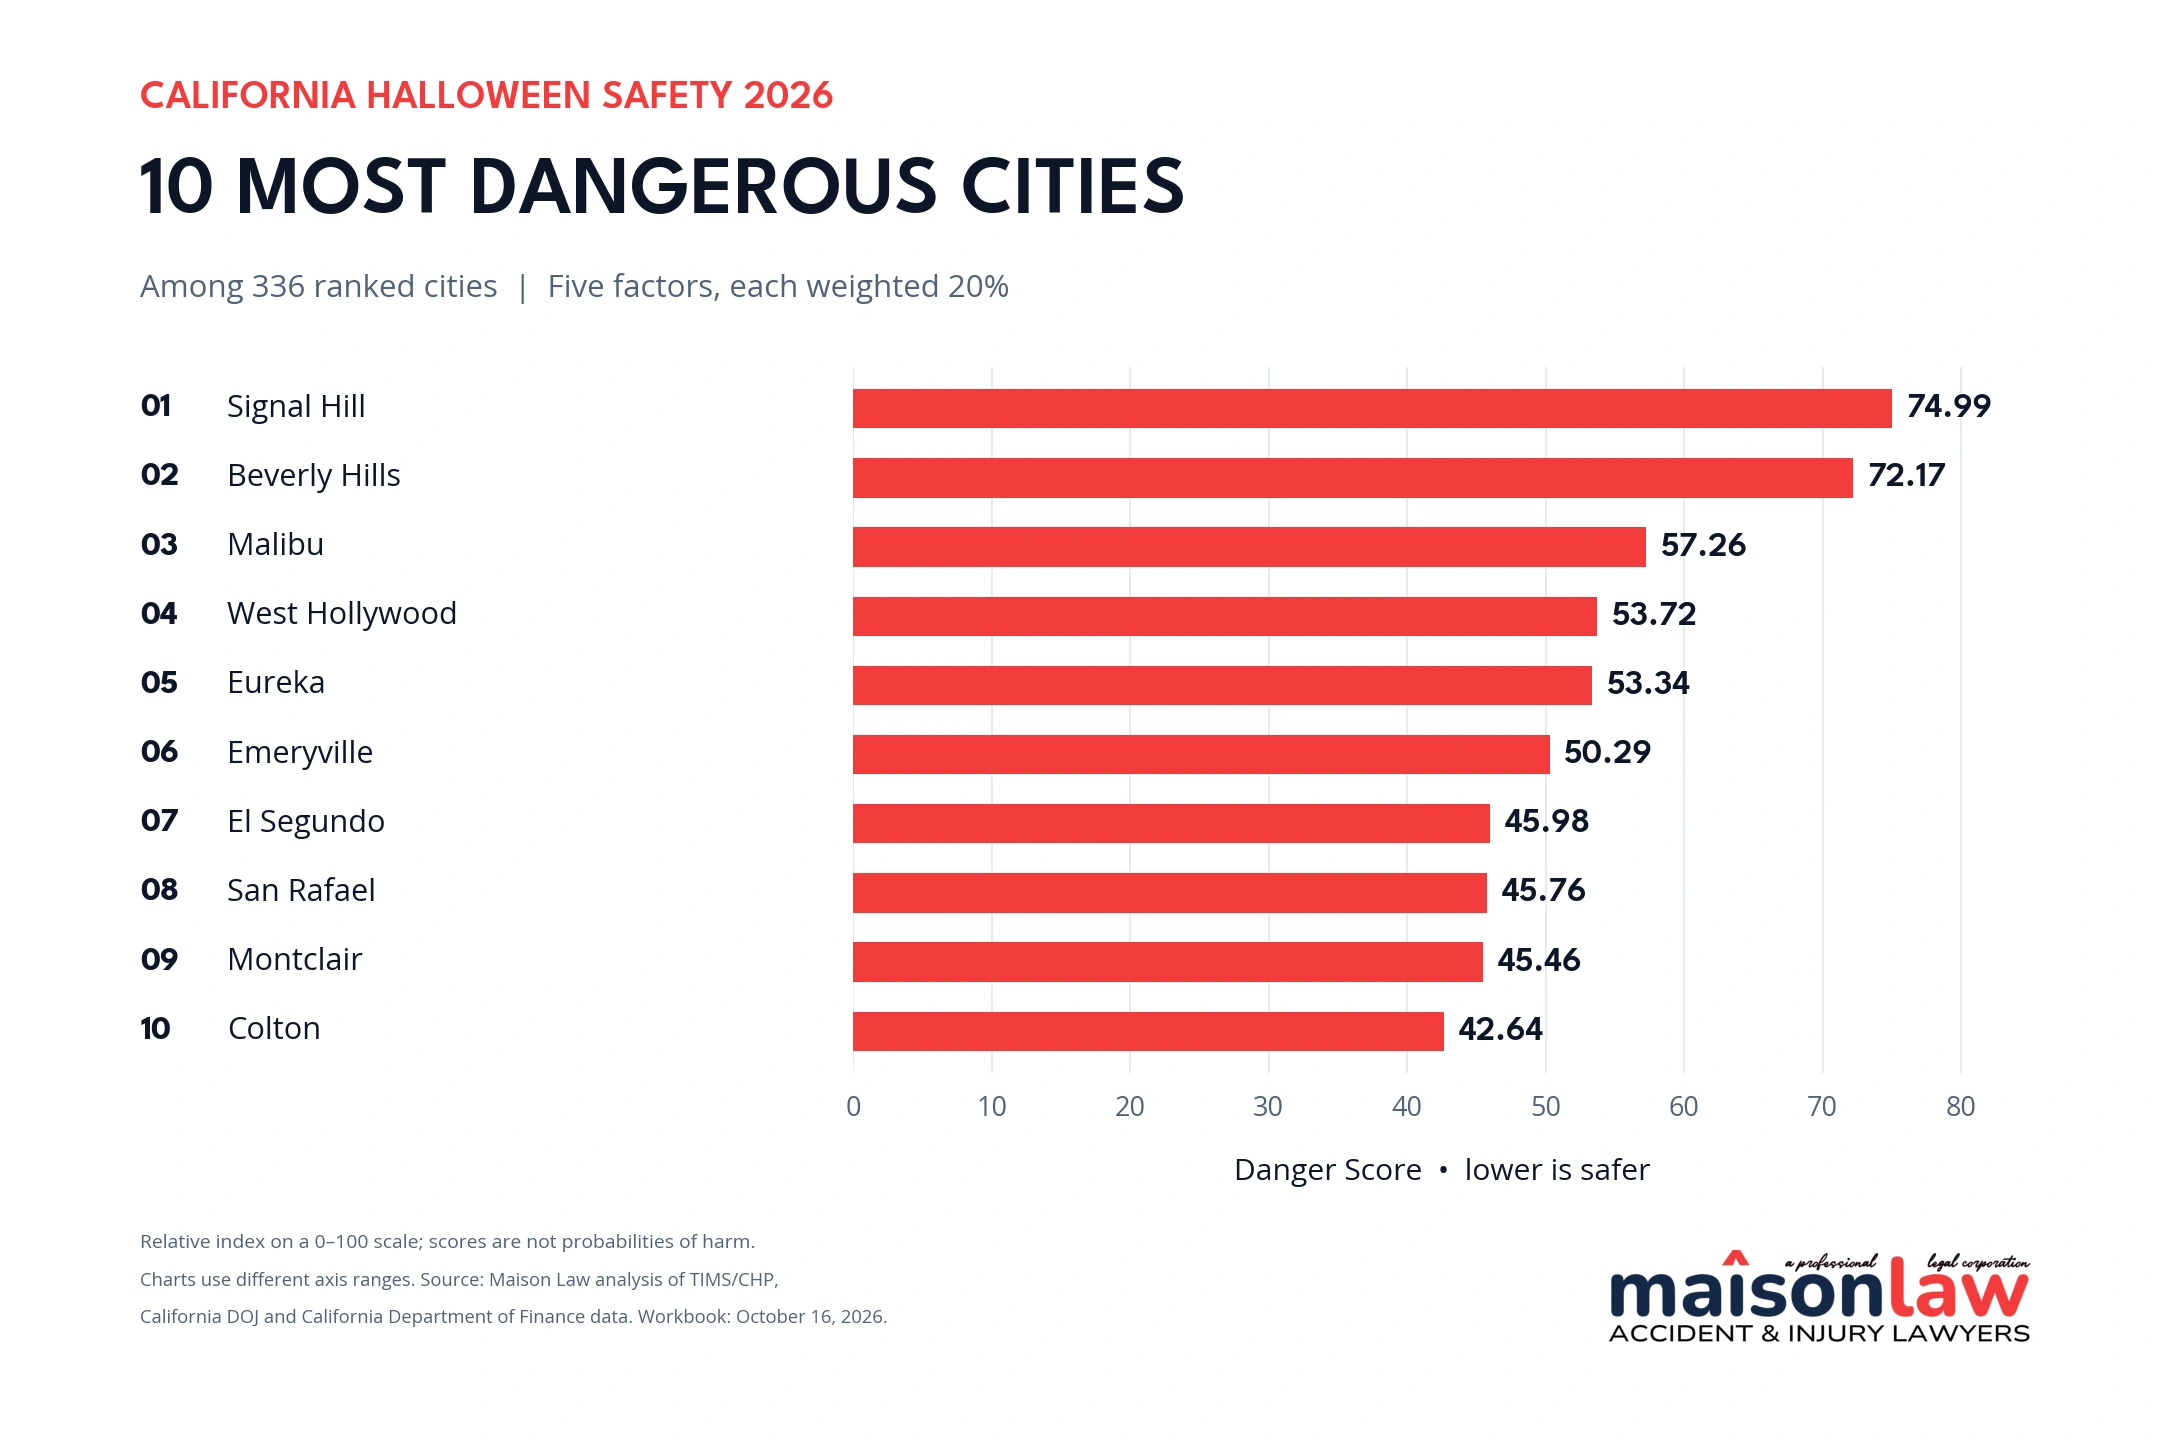
The ten highest Danger Scores in the California Halloween safety index. Scores are rounded to two decimal places.
The 25 most dangerous cities
| Rank | City | County | Danger Score |
|---|---|---|---|
| 1 | Signal Hill | Los Angeles | 74.99 |
| 2 | Beverly Hills | Los Angeles | 72.17 |
| 3 | Malibu | Los Angeles | 57.26 |
| 4 | West Hollywood | Los Angeles | 53.72 |
| 5 | Eureka | Humboldt | 53.34 |
| 6 | Emeryville | Alameda | 50.29 |
| 7 | El Segundo | Los Angeles | 45.98 |
| 8 | San Rafael | Marin | 45.76 |
| 9 | Montclair | San Bernardino | 45.46 |
| 10 | Colton | San Bernardino | 42.64 |
| 11 | National City | San Diego | 42.00 |
| 12 | Sacramento | Sacramento | 41.39 |
| 13 | Monterey | Monterey | 40.05 |
| 14 | Santa Barbara | Santa Barbara | 39.97 |
| 15 | Los Alamitos | Orange | 39.88 |
| 16 | San Bernardino | San Bernardino | 39.29 |
| 17 | Modesto | Stanislaus | 39.12 |
| 18 | Oakland | Alameda | 38.96 |
| 19 | Ontario | San Bernardino | 38.54 |
| 20 | Berkeley | Alameda | 37.98 |
| 21 | Clearlake | Lake | 37.05 |
| 22 | Santa Monica | Los Angeles | 36.94 |
| 23 | Pomona | Los Angeles | 36.28 |
| 24 | Monrovia | Los Angeles | 36.06 |
| 25 | Laguna Beach | Orange | 35.34 |
Higher Danger Scores indicate less favorable conditions in this index. A score of 74.99 is not a 74.99 percent probability of harm.
The safest California cities for Halloween
Canyon Lake has the lowest Danger Score at 1.01, followed by Clayton at 1.23 and Rancho Santa Margarita at 1.76. Canyon Lake’s mean seasonal crash rate is 3.06 per 100,000 residents.
Clayton has no fatal or injury crashes recorded in the TIMS download for the three study windows. Its score is still above zero because the index also includes long-term crashes and October crime. An absence of crashes in this export does not establish that a city had no property-damage-only collisions or no unreported incidents.
The safest 25 include cities from several parts of California. Contra Costa, Orange and Fresno counties each place three cities on the list. Brawley is the only Imperial County city on the list, while Canyon Lake and Blythe represent Riverside County.
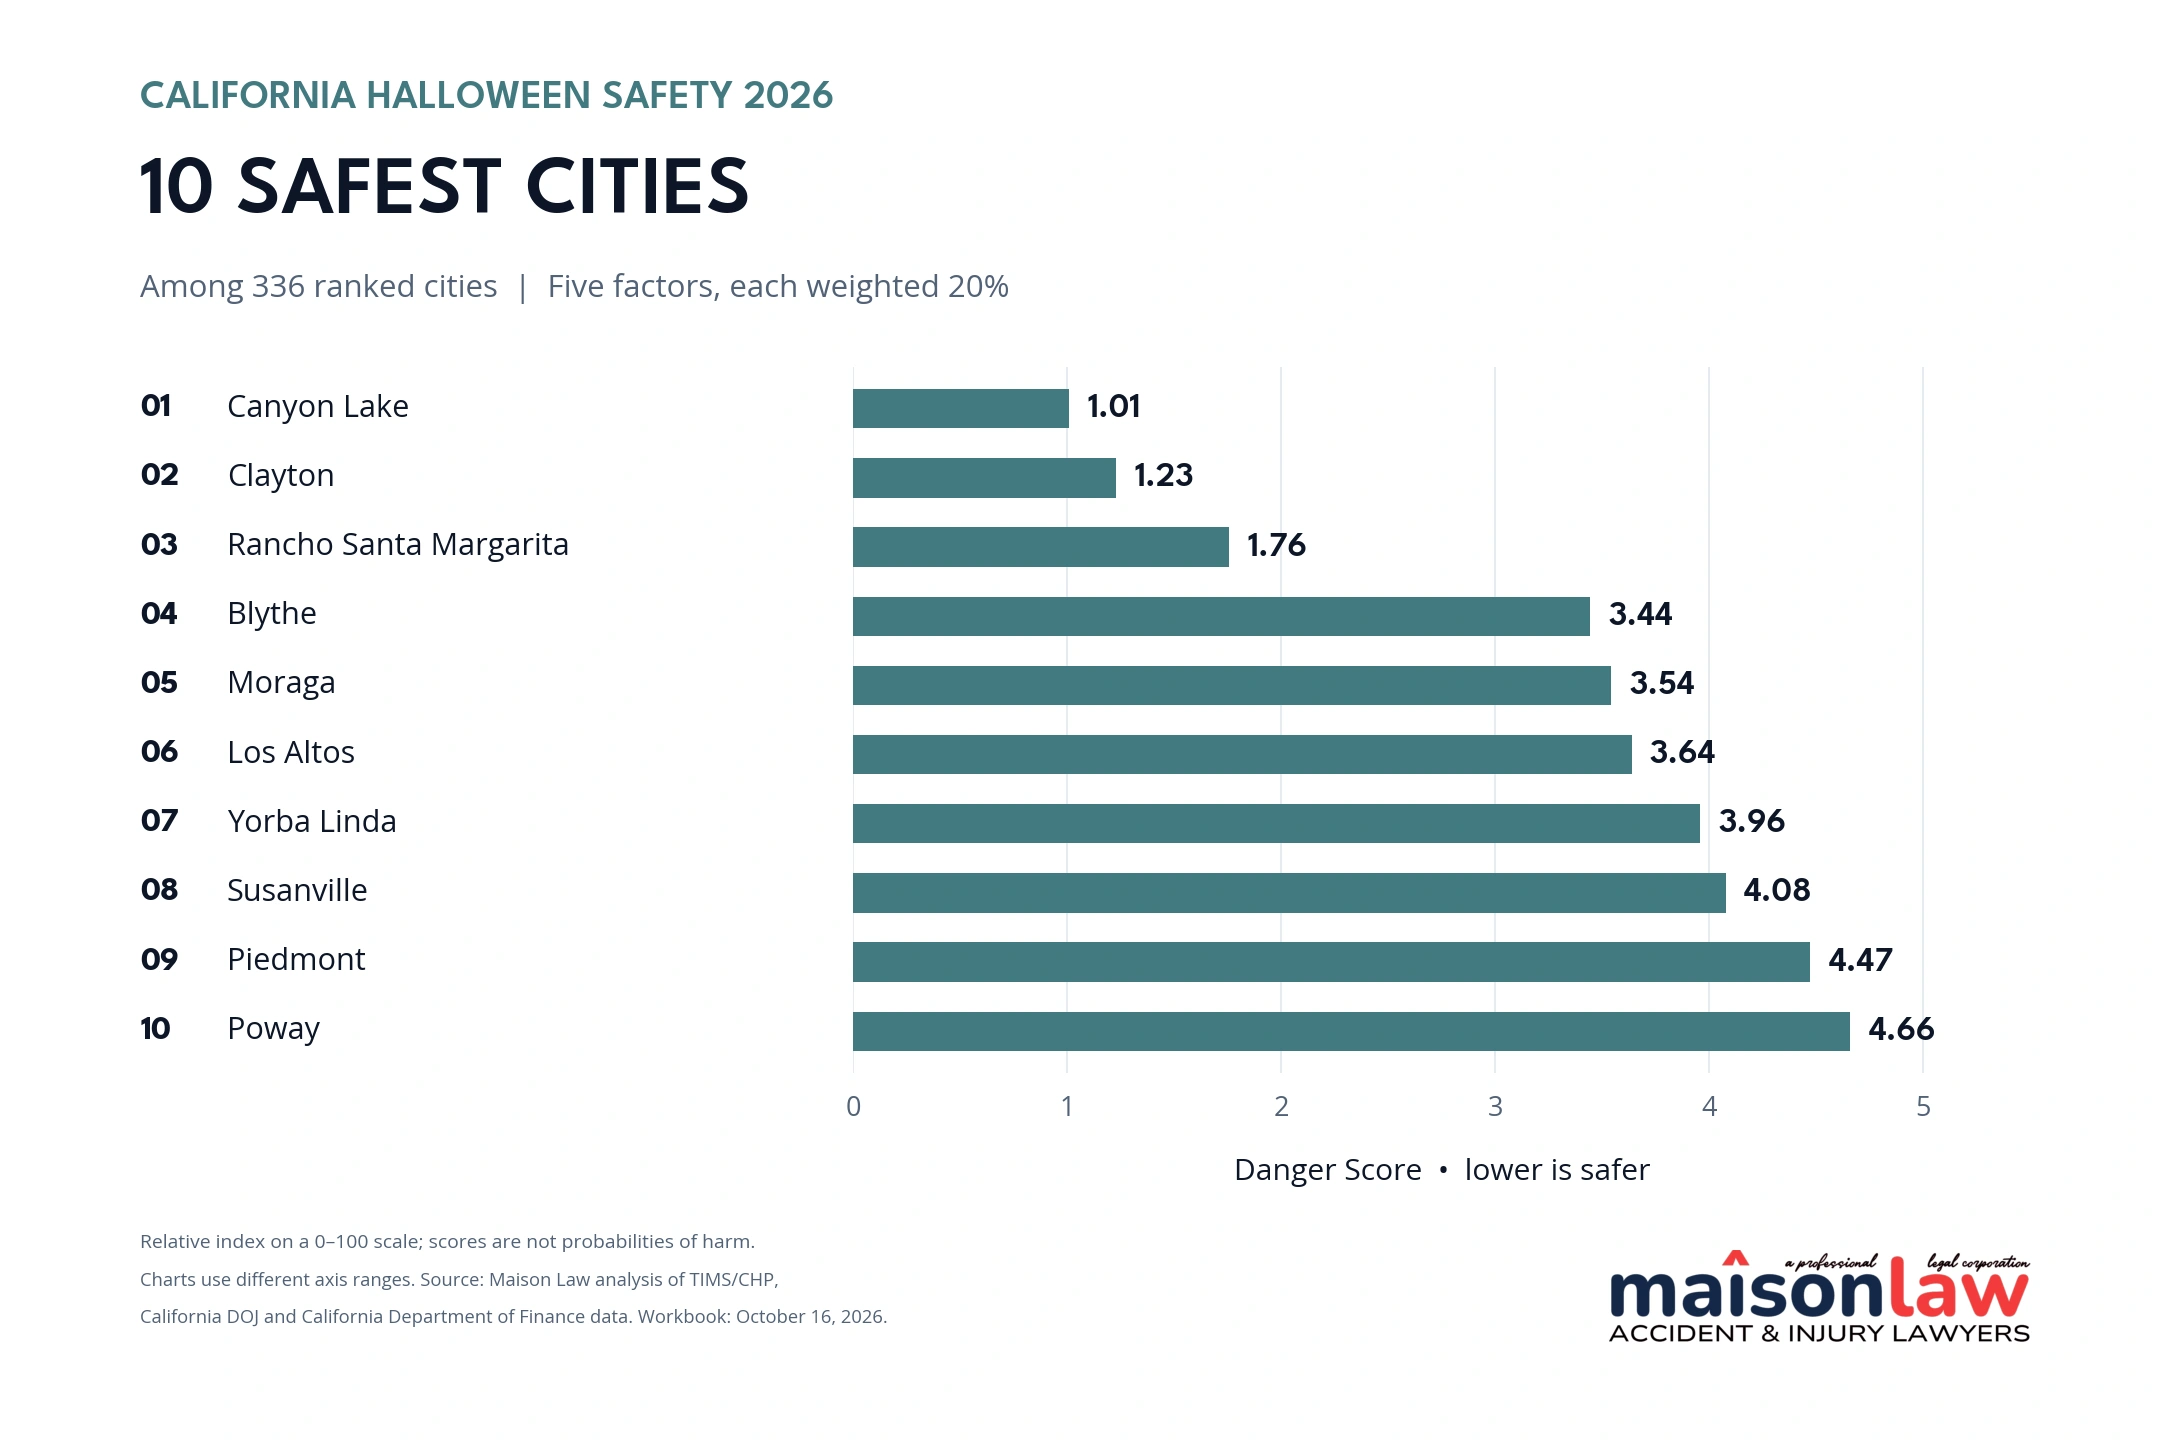
The ten lowest Danger Scores in the California Halloween safety index. The two charts use different horizontal-axis ranges; both display the same 0–100 score.
The 25 safest cities
| Rank | City | County | Danger Score |
|---|---|---|---|
| 1 | Canyon Lake | Riverside | 1.01 |
| 2 | Clayton | Contra Costa | 1.23 |
| 3 | Rancho Santa Margarita | Orange | 1.76 |
| 4 | Blythe | Riverside | 3.44 |
| 5 | Moraga | Contra Costa | 3.54 |
| 6 | Los Altos | Santa Clara | 3.64 |
| 7 | Yorba Linda | Orange | 3.96 |
| 8 | Susanville | Lassen | 4.08 |
| 9 | Piedmont | Alameda | 4.47 |
| 10 | Poway | San Diego | 4.66 |
| 11 | Brawley | Imperial | 4.76 |
| 12 | Scotts Valley | Santa Cruz | 5.12 |
| 13 | Lincoln | Placer | 5.24 |
| 14 | Newman | Stanislaus | 5.28 |
| 15 | Santee | San Diego | 5.30 |
| 16 | Walnut | Los Angeles | 5.34 |
| 17 | Parlier | Fresno | 5.50 |
| 18 | Danville | Contra Costa | 5.54 |
| 19 | Sanger | Fresno | 5.65 |
| 20 | Saratoga | Santa Clara | 5.73 |
| 21 | California City | Kern | 5.82 |
| 22 | Reedley | Fresno | 5.89 |
| 23 | Hillsborough | San Mateo | 5.90 |
| 24 | Soledad | Monterey | 5.97 |
| 25 | Laguna Woods | Orange | 6.02 |
How Central Valley cities compare
The results show substantial variation within the Central Valley. Modesto places 17th and Turlock 35th on the most dangerous list, Bakersfield and Fresno sit near the middle at 103rd and 104th, and Hanford ranks 248th. Among the six cities below, Turlock has the highest Danger Score and Hanford the lowest.
| City | Danger rank out of 336 | Danger Score |
|---|---|---|
| Turlock | 35 | 32.77 |
| Bakersfield | 103 | 24.08 |
| Fresno | 104 | 24.03 |
| Madera | 162 | 19.67 |
| Visalia | 171 | 19.04 |
| Hanford | 248 | 13.24 |
Danger rank 1 is the highest-scoring city. These positions reflect the five-factor index; they do not measure Halloween-night incidents alone.
How we built the rankings
Maison Law scored 336 incorporated California cities with populations of at least 10,000 in 2025 that had complete, internally consistent data for all five factors. Another 40 cities of that size are not ranked and are listed with the reason at the end of this report. Commerce and Santa Fe Springs were excluded as industrial cities, where per-resident rates are not comparable with those of other cities.
For the crash and crime factors, we divided each year’s count by that year’s city population and multiplied by 100,000. We then averaged the annual rates. Each factor was min–max normalized across the ranked cities, placing the lowest observed rate at 0 and the highest at 1. The Danger Score is the mean of the five normalized factors multiplied by 100.
Before scoring, we reviewed every city’s data for signs of incomplete reporting. We left out cities that failed the review rather than treat missing records as safe conditions. For crashes, we compiled every fatal and injury crash record in TIMS for 2020 through 2025. We excluded 18 cities that showed almost no recorded crashes, years with no crashes at all, or sudden permanent changes in their annual counts. Examples include Calexico, Rancho Palos Verdes and Gardena. Five of those cities (Folsom, Culver City, Lemon Grove, Santa Paula and Burbank) were excluded because their 2025 counts fell far below earlier years, and TIMS labels 2025 data as provisional. For crime, we followed the limitations California DOJ publishes for individual agencies and excluded seven cities with documented gaps in their 2023 records: Cathedral City, Garden Grove, Imperial, Lompoc, Orange, Santa Cruz and West Sacramento. Delano, Dinuba and Montebello did not have complete crash records in 2021 and 2022, so their long-term average uses 2023 through 2025. Avenal and Kerman were left out because we could not verify their very low counts.
| Factor | Measure | Weight |
|---|---|---|
| Seasonal crashes | Mean fatal and injury crash rate for the supplied October and adjacent-weekend windows in 2023–2025. | 1/5 |
| Alcohol-involved crashes | Same windows and calculation, limited to crashes marked alcohol-involved in TIMS. | 1/5 |
| Pedestrian-involved crashes | Same windows and calculation, limited to crashes involving pedestrians. | 1/5 |
| Long-term crashes | Mean annual fatal and injury crash rate for 2021–2025. Delano, Dinuba and Montebello use 2023–2025 because their early records are incomplete. | 1/5 |
| October crime | Mean October reported violent-plus-property-crime rate for 2023–2025. | 1/5 |
Each factor receives exactly one-fifth of the total weight, or 20 percent. Seasonal alcohol and pedestrian crashes are subsets of the overall seasonal crash count and may overlap. This deliberate weighting gives the three seasonal traffic measures 60 percent of the total score, with another 20 percent assigned to long-term crashes.
Study periods and data sources
The seasonal crash windows are October 1–31, 2023; October 1–November 3, 2024; and October 1–November 2, 2025. We retained the extra weekend days in the TIMS download. These are mean rates per study window, not daily rates; the longer windows provide more days in which a crash could occur. Crime records cover October only in each of the three years. The long-term crash factor averages each city’s annual rate for 2021 through 2025, except Delano, Dinuba and Montebello, which use 2023 through 2025. Across the three seasonal windows, TIMS records 49,470 fatal and injury crashes statewide, including 37,118 inside incorporated cities.
Crash data come from UC Berkeley’s Transportation Injury Mapping System, using CHP’s Statewide Integrated Traffic Records System. We downloaded all TIMS crash records for 2020 through 2025 on October 16, 2026, and every crash figure in this report comes from that download. Crime data come from California DOJ OpenJustice, and yearly city populations come from California Department of Finance E-5 estimates.
What these rankings can and cannot show
- TIMS contains fatal and injury collisions for this analysis, excluding property-damage-only collisions. TIMS labels crash records for 2025 and later as provisional, so 2025 counts may rise as CHP data entry catches up. Counts reflect the October 16, 2026 download.
- The alcohol-involved flag means at least one party had been drinking. It does not necessarily establish legal intoxication, a DUI conviction or that alcohol caused the collision.
- Crime counts reflect reported incidents assigned to a matched city reporting agency. They are not counts of Halloween-only offenses. Shared sheriff, transit, campus and other agency totals were not assigned to individual cities.
- Rates use resident populations, not traffic volumes, visitor counts or miles traveled. Small cities and places with substantial commuter or visitor activity can have high per-resident rates.
- Missing crime or population data are not zeros. Cities lacking required inputs were excluded rather than given artificially low scores, and a city’s absence from the rankings does not mean it is safe or dangerous. Cities with zero or unusually low TIMS counts were checked against six years of data and left out when the pattern pointed to incomplete reporting.
- Rankings are sensitive to scoring choices. Re-scoring with percentile ranks instead of min–max normalization keeps 21 of the 25 most dangerous cities and 21 of the 25 safest, but changes the order within the lists, so ranks are best read as approximate.
Planning a safer Halloween
The National Highway Traffic Safety Administration warns drivers to expect pedestrians in unusual places around Halloween, including children who may enter the road unexpectedly. Its Halloween guidance also emphasizes arranging a sober ride before drinking.
- Drivers: Slow down, scan for people walking and stay alert for children near residential streets and crossings.
- Families and pedestrians: Travel with a buddy or group, obey traffic signals and use crosswalks or intersections when possible. Check for vehicles coming from every direction.
- Partygoers and hosts: Choose a sober driver or arrange a taxi or rideshare before drinking. Hosts should help guests make a safe plan to get home.
A city’s rank cannot replace attention to the route, lighting, crossings and traffic conditions where you will actually be walking or driving. The findings offer a starting point for understanding local patterns and planning ahead.
Full rankings for all 336 cities
Search this table for any city. Rank 1 is the highest Danger Score. Rank 336 is the lowest. Scores are rounded to two decimal places. An asterisk marks Delano, Dinuba and Montebello, whose long-term crash average uses 2023 through 2025.
| Rank | City | County | Danger Score |
|---|---|---|---|
| 1 | Signal Hill | Los Angeles | 74.99 |
| 2 | Beverly Hills | Los Angeles | 72.17 |
| 3 | Malibu | Los Angeles | 57.26 |
| 4 | West Hollywood | Los Angeles | 53.72 |
| 5 | Eureka | Humboldt | 53.34 |
| 6 | Emeryville | Alameda | 50.29 |
| 7 | El Segundo | Los Angeles | 45.98 |
| 8 | San Rafael | Marin | 45.76 |
| 9 | Montclair | San Bernardino | 45.46 |
| 10 | Colton | San Bernardino | 42.64 |
| 11 | National City | San Diego | 42.00 |
| 12 | Sacramento | Sacramento | 41.39 |
| 13 | Monterey | Monterey | 40.05 |
| 14 | Santa Barbara | Santa Barbara | 39.97 |
| 15 | Los Alamitos | Orange | 39.88 |
| 16 | San Bernardino | San Bernardino | 39.29 |
| 17 | Modesto | Stanislaus | 39.12 |
| 18 | Oakland | Alameda | 38.96 |
| 19 | Ontario | San Bernardino | 38.54 |
| 20 | Berkeley | Alameda | 37.98 |
| 21 | Clearlake | Lake | 37.05 |
| 22 | Santa Monica | Los Angeles | 36.94 |
| 23 | Pomona | Los Angeles | 36.28 |
| 24 | Monrovia | Los Angeles | 36.06 |
| 25 | Laguna Beach | Orange | 35.34 |
| 26 | Redlands | San Bernardino | 35.30 |
| 27 | Fairfield | Solano | 34.92 |
| 28 | Marysville | Yuba | 34.64 |
| 29 | San Leandro | Alameda | 34.56 |
| 30 | Long Beach | Los Angeles | 34.27 |
| 31 | San Francisco | San Francisco | 34.08 |
| 32 | Riverside | Riverside | 33.48 |
| 33 | San Gabriel | Los Angeles | 33.04 |
| 34 | Pasadena | Los Angeles | 33.02 |
| 35 | Turlock | Stanislaus | 32.77 |
| 36 | Seaside | Monterey | 32.75 |
| 37 | Red Bluff | Tehama | 32.43 |
| 38 | Anaheim | Orange | 32.06 |
| 39 | Oroville | Butte | 31.97 |
| 40 | San Buenaventura (Ventura) | Ventura | 31.83 |
| 41 | El Monte | Los Angeles | 31.81 |
| 42 | Palm Springs | Riverside | 31.77 |
| 43 | Upland | San Bernardino | 31.65 |
| 44 | Jurupa Valley | Riverside | 31.54 |
| 45 | La Palma | Orange | 31.43 |
| 46 | San Pablo | Contra Costa | 31.17 |
| 47 | Santa Maria | Santa Barbara | 31.01 |
| 48 | Monterey Park | Los Angeles | 30.37 |
| 49 | Pleasant Hill | Contra Costa | 30.33 |
| 50 | Newport Beach | Orange | 29.98 |
| 51 | Stockton | San Joaquin | 29.86 |
| 52 | Bell | Los Angeles | 29.78 |
| 53 | Oxnard | Ventura | 29.77 |
| 54 | Lancaster | Los Angeles | 29.67 |
| 55 | South El Monte | Los Angeles | 29.63 |
| 56 | Escondido | San Diego | 29.19 |
| 57 | Bell Gardens | Los Angeles | 29.12 |
| 58 | Huntington Park | Los Angeles | 29.08 |
| 59 | Inglewood | Los Angeles | 29.07 |
| 60 | El Cajon | San Diego | 28.73 |
| 61 | Dixon | Solano | 28.63 |
| 62 | San Jacinto | Riverside | 28.47 |
| 63 | Santa Ana | Orange | 28.16 |
| 64 | Oceanside | San Diego | 27.85 |
| 65 | Merced | Merced | 27.71 |
| 66 | Rosemead | Los Angeles | 27.67 |
| 67 | South San Francisco | San Mateo | 27.51 |
| 68 | Goleta | Santa Barbara | 27.17 |
| 69 | South Gate | Los Angeles | 27.07 |
| 70 | Baldwin Park | Los Angeles | 27.06 |
| 71 | Norwalk | Los Angeles | 27.03 |
| 72 | Rialto | San Bernardino | 26.80 |
| 73 | La Mesa | San Diego | 26.78 |
| 74 | Vallejo | Solano | 26.67 |
| 75 | Cerritos | Los Angeles | 26.65 |
| 76 | Albany | Alameda | 26.25 |
| 77 | Hawthorne | Los Angeles | 26.16 |
| 78 | San Marino | Los Angeles | 26.14 |
| 79 | Huntington Beach | Orange | 25.98 |
| 80 | Fullerton | Orange | 25.92 |
| 81 | Diamond Bar | Los Angeles | 25.90 |
| 82 | Hesperia | San Bernardino | 25.77 |
| 83 | Bellflower | Los Angeles | 25.74 |
| 84 | San Diego | San Diego | 25.70 |
| 85 | Concord | Contra Costa | 25.64 |
| 86 | Lathrop | San Joaquin | 25.59 |
| 87 | Ceres | Stanislaus | 25.57 |
| 88 | Compton | Los Angeles | 25.44 |
| 89 | Montebello* | Los Angeles | 25.34 |
| 90 | Paramount | Los Angeles | 25.33 |
| 91 | Perris | Riverside | 25.03 |
| 92 | Redding | Shasta | 25.01 |
| 93 | San Luis Obispo | San Luis Obispo | 24.80 |
| 94 | Encinitas | San Diego | 24.71 |
| 95 | Artesia | Los Angeles | 24.68 |
| 96 | Norco | Riverside | 24.36 |
| 97 | Claremont | Los Angeles | 24.30 |
| 98 | Yucca Valley | San Bernardino | 24.28 |
| 99 | Farmersville | Tulare | 24.26 |
| 100 | Rancho Cordova | Sacramento | 24.19 |
| 101 | Porterville | Tulare | 24.09 |
| 102 | Yuba City | Sutter | 24.09 |
| 103 | Bakersfield | Kern | 24.08 |
| 104 | Fresno | Fresno | 24.03 |
| 105 | Lynwood | Los Angeles | 23.88 |
| 106 | Richmond | Contra Costa | 23.81 |
| 107 | Lakewood | Los Angeles | 23.75 |
| 108 | Thousand Oaks | Ventura | 23.55 |
| 109 | Calimesa | Riverside | 23.36 |
| 110 | Whittier | Los Angeles | 23.32 |
| 111 | Healdsburg | Sonoma | 22.94 |
| 112 | Moreno Valley | Riverside | 22.94 |
| 113 | Los Angeles | Los Angeles | 22.92 |
| 114 | San Jose | Santa Clara | 22.88 |
| 115 | Buena Park | Orange | 22.79 |
| 116 | Riverbank | Stanislaus | 22.75 |
| 117 | San Dimas | Los Angeles | 22.74 |
| 118 | Maywood | Los Angeles | 22.61 |
| 119 | Watsonville | Santa Cruz | 22.52 |
| 120 | San Fernando | Los Angeles | 22.47 |
| 121 | Palm Desert | Riverside | 22.37 |
| 122 | Benicia | Solano | 22.31 |
| 123 | Corona | Riverside | 22.09 |
| 124 | Roseville | Placer | 22.07 |
| 125 | Sonoma | Sonoma | 21.87 |
| 126 | Glendora | Los Angeles | 21.81 |
| 127 | Novato | Marin | 21.79 |
| 128 | Murrieta | Riverside | 21.78 |
| 129 | Highland | San Bernardino | 21.76 |
| 130 | Lake Elsinore | Riverside | 21.72 |
| 131 | Alameda | Alameda | 21.72 |
| 132 | San Juan Capistrano | Orange | 21.66 |
| 133 | Salinas | Monterey | 21.63 |
| 134 | Menlo Park | San Mateo | 21.51 |
| 135 | Arcadia | Los Angeles | 21.40 |
| 136 | Davis | Yolo | 21.16 |
| 137 | Hawaiian Gardens | Los Angeles | 21.06 |
| 138 | Mountain View | Santa Clara | 21.05 |
| 139 | Temecula | Riverside | 20.99 |
| 140 | Palmdale | Los Angeles | 20.85 |
| 141 | Carlsbad | San Diego | 20.82 |
| 142 | Livingston | Merced | 20.79 |
| 143 | Brea | Orange | 20.77 |
| 144 | Tustin | Orange | 20.73 |
| 145 | Laguna Hills | Orange | 20.71 |
| 146 | Petaluma | Sonoma | 20.70 |
| 147 | Hayward | Alameda | 20.54 |
| 148 | Chino | San Bernardino | 20.48 |
| 149 | Walnut Creek | Contra Costa | 20.45 |
| 150 | Manhattan Beach | Los Angeles | 20.41 |
| 151 | Pleasanton | Alameda | 20.40 |
| 152 | Hermosa Beach | Los Angeles | 20.39 |
| 153 | Desert Hot Springs | Riverside | 20.35 |
| 154 | Barstow | San Bernardino | 20.25 |
| 155 | Hemet | Riverside | 20.19 |
| 156 | Manteca | San Joaquin | 20.14 |
| 157 | La Quinta | Riverside | 20.09 |
| 158 | Citrus Heights | Sacramento | 19.94 |
| 159 | San Mateo | San Mateo | 19.90 |
| 160 | Hollister | San Benito | 19.87 |
| 161 | Chula Vista | San Diego | 19.76 |
| 162 | Madera | Madera | 19.67 |
| 163 | Simi Valley | Ventura | 19.53 |
| 164 | Napa | Napa | 19.35 |
| 165 | La Cañada Flintridge | Los Angeles | 19.31 |
| 166 | Ripon | San Joaquin | 19.28 |
| 167 | Livermore | Alameda | 19.12 |
| 168 | San Clemente | Orange | 19.11 |
| 169 | Glendale | Los Angeles | 19.09 |
| 170 | Carson | Los Angeles | 19.09 |
| 171 | Visalia | Tulare | 19.04 |
| 172 | Rancho Mirage | Riverside | 18.93 |
| 173 | Camarillo | Ventura | 18.86 |
| 174 | South Lake Tahoe | El Dorado | 18.78 |
| 175 | Seal Beach | Orange | 18.76 |
| 176 | Lawndale | Los Angeles | 18.74 |
| 177 | Fillmore | Ventura | 18.55 |
| 178 | Suisun City | Solano | 18.53 |
| 179 | El Paso de Robles (Paso Robles) | San Luis Obispo | 18.52 |
| 180 | Pinole | Contra Costa | 18.50 |
| 181 | Pico Rivera | Los Angeles | 18.50 |
| 182 | Burlingame | San Mateo | 18.48 |
| 183 | Vacaville | Solano | 18.42 |
| 184 | Redondo Beach | Los Angeles | 18.34 |
| 185 | Dana Point | Orange | 18.32 |
| 186 | Antioch | Contra Costa | 18.25 |
| 187 | Sunnyvale | Santa Clara | 18.23 |
| 188 | Redwood City | San Mateo | 18.22 |
| 189 | Azusa | Los Angeles | 18.22 |
| 190 | Victorville | San Bernardino | 18.19 |
| 191 | Fremont | Alameda | 18.16 |
| 192 | Torrance | Los Angeles | 18.09 |
| 193 | Vista | San Diego | 17.98 |
| 194 | Arcata | Humboldt | 17.84 |
| 195 | King City | Monterey | 17.77 |
| 196 | La Verne | Los Angeles | 17.72 |
| 197 | Pittsburg | Contra Costa | 17.65 |
| 198 | Union City | Alameda | 17.55 |
| 199 | La Habra | Orange | 17.45 |
| 200 | Woodland | Yolo | 17.43 |
| 201 | Brentwood | Contra Costa | 17.11 |
| 202 | Covina | Los Angeles | 17.02 |
| 203 | Placentia | Orange | 16.98 |
| 204 | Banning | Riverside | 16.98 |
| 205 | Loma Linda | San Bernardino | 16.86 |
| 206 | Mill Valley | Marin | 16.85 |
| 207 | Milpitas | Santa Clara | 16.69 |
| 208 | Kingsburg | Fresno | 16.40 |
| 209 | Ukiah | Mendocino | 16.39 |
| 210 | Rancho Cucamonga | San Bernardino | 16.26 |
| 211 | Fontana | San Bernardino | 16.11 |
| 212 | El Centro | Imperial | 16.05 |
| 213 | Santa Rosa | Sonoma | 15.97 |
| 214 | Duarte | Los Angeles | 15.95 |
| 215 | Daly City | San Mateo | 15.80 |
| 216 | Newark | Alameda | 15.70 |
| 217 | Stanton | Orange | 15.66 |
| 218 | Yucaipa | San Bernardino | 15.64 |
| 219 | Santa Clara | Santa Clara | 15.61 |
| 220 | Tehachapi | Kern | 15.44 |
| 221 | Gilroy | Santa Clara | 15.43 |
| 222 | La Puente | Los Angeles | 15.39 |
| 223 | Menifee | Riverside | 15.36 |
| 224 | Oakdale | Stanislaus | 15.35 |
| 225 | Agoura Hills | Los Angeles | 15.34 |
| 226 | Alhambra | Los Angeles | 15.31 |
| 227 | Solana Beach | San Diego | 15.25 |
| 228 | Arroyo Grande | San Luis Obispo | 15.21 |
| 229 | Rohnert Park | Sonoma | 15.14 |
| 230 | West Covina | Los Angeles | 14.96 |
| 231 | Campbell | Santa Clara | 14.90 |
| 232 | Grover Beach | San Luis Obispo | 14.62 |
| 233 | Delano* | Kern | 14.52 |
| 234 | Grand Terrace | San Bernardino | 14.31 |
| 235 | San Bruno | San Mateo | 14.29 |
| 236 | Calabasas | Los Angeles | 14.26 |
| 237 | Apple Valley | San Bernardino | 14.23 |
| 238 | San Marcos | San Diego | 14.18 |
| 239 | Chico | Butte | 14.15 |
| 240 | Auburn | Placer | 14.08 |
| 241 | Truckee | Nevada | 14.04 |
| 242 | Pacifica | San Mateo | 13.83 |
| 243 | East Palo Alto | San Mateo | 13.79 |
| 244 | Los Gatos | Santa Clara | 13.73 |
| 245 | Galt | Sacramento | 13.69 |
| 246 | Chowchilla | Madera | 13.59 |
| 247 | Coronado | San Diego | 13.52 |
| 248 | Hanford | Kings | 13.24 |
| 249 | Tracy | San Joaquin | 13.22 |
| 250 | Patterson | Stanislaus | 12.97 |
| 251 | Atwater | Merced | 12.83 |
| 252 | Clovis | Fresno | 12.81 |
| 253 | Atascadero | San Luis Obispo | 12.76 |
| 254 | Palo Alto | Santa Clara | 12.71 |
| 255 | Santa Clarita | Los Angeles | 12.66 |
| 256 | Morgan Hill | Santa Clara | 12.48 |
| 257 | Lake Forest | Orange | 12.33 |
| 258 | Placerville | El Dorado | 12.21 |
| 259 | Belmont | San Mateo | 12.12 |
| 260 | Marina | Monterey | 12.02 |
| 261 | Cudahy | Los Angeles | 11.89 |
| 262 | Shafter | Kern | 11.86 |
| 263 | La Mirada | Los Angeles | 11.71 |
| 264 | Indio | Riverside | 11.66 |
| 265 | South Pasadena | Los Angeles | 11.62 |
| 266 | Adelanto | San Bernardino | 11.61 |
| 267 | Elk Grove | Sacramento | 11.50 |
| 268 | Irvine | Orange | 11.44 |
| 269 | Coachella | Riverside | 11.32 |
| 270 | Hercules | Contra Costa | 11.29 |
| 271 | Selma | Fresno | 11.27 |
| 272 | Foster City | San Mateo | 11.17 |
| 273 | Cypress | Orange | 11.05 |
| 274 | Martinez | Contra Costa | 10.88 |
| 275 | Mission Viejo | Orange | 10.87 |
| 276 | Pacific Grove | Monterey | 10.69 |
| 277 | Greenfield | Monterey | 10.68 |
| 278 | Port Hueneme | Ventura | 10.57 |
| 279 | Lemoore | Kings | 10.42 |
| 280 | Grass Valley | Nevada | 10.39 |
| 281 | Corcoran | Kings | 10.38 |
| 282 | Dublin | Alameda | 10.38 |
| 283 | Carpinteria | Santa Barbara | 10.36 |
| 284 | Ridgecrest | Kern | 10.33 |
| 285 | Wildomar | Riverside | 10.26 |
| 286 | Temple City | Los Angeles | 10.17 |
| 287 | El Cerrito | Contra Costa | 9.87 |
| 288 | Eastvale | Riverside | 9.84 |
| 289 | Laguna Niguel | Orange | 9.78 |
| 290 | Cupertino | Santa Clara | 9.63 |
| 291 | Oakley | Contra Costa | 9.47 |
| 292 | Morro Bay | San Luis Obispo | 9.46 |
| 293 | Windsor | Sonoma | 9.44 |
| 294 | Lafayette | Contra Costa | 9.28 |
| 295 | Moorpark | Ventura | 9.25 |
| 296 | Rocklin | Placer | 9.24 |
| 297 | Dinuba* | Tulare | 8.64 |
| 298 | Beaumont | Riverside | 8.18 |
| 299 | Imperial Beach | San Diego | 8.09 |
| 300 | Sierra Madre | Los Angeles | 7.97 |
| 301 | San Ramon | Contra Costa | 7.86 |
| 302 | American Canyon | Napa | 7.71 |
| 303 | Anderson | Shasta | 7.27 |
| 304 | Lindsay | Tulare | 7.08 |
| 305 | Mendota | Fresno | 7.08 |
| 306 | Aliso Viejo | Orange | 7.06 |
| 307 | Tulare | Tulare | 7.00 |
| 308 | Twentynine Palms | San Bernardino | 6.65 |
| 309 | Chino Hills | San Bernardino | 6.52 |
| 310 | Orinda | Contra Costa | 6.42 |
| 311 | Palos Verdes Estates | Los Angeles | 6.13 |
| 312 | Laguna Woods | Orange | 6.02 |
| 313 | Soledad | Monterey | 5.97 |
| 314 | Hillsborough | San Mateo | 5.90 |
| 315 | Reedley | Fresno | 5.89 |
| 316 | California City | Kern | 5.82 |
| 317 | Saratoga | Santa Clara | 5.73 |
| 318 | Sanger | Fresno | 5.65 |
| 319 | Danville | Contra Costa | 5.54 |
| 320 | Parlier | Fresno | 5.50 |
| 321 | Walnut | Los Angeles | 5.34 |
| 322 | Santee | San Diego | 5.30 |
| 323 | Newman | Stanislaus | 5.28 |
| 324 | Lincoln | Placer | 5.24 |
| 325 | Scotts Valley | Santa Cruz | 5.12 |
| 326 | Brawley | Imperial | 4.76 |
| 327 | Poway | San Diego | 4.66 |
| 328 | Piedmont | Alameda | 4.47 |
| 329 | Susanville | Lassen | 4.08 |
| 330 | Yorba Linda | Orange | 3.96 |
| 331 | Los Altos | Santa Clara | 3.64 |
| 332 | Moraga | Contra Costa | 3.54 |
| 333 | Blythe | Riverside | 3.44 |
| 334 | Rancho Santa Margarita | Orange | 1.76 |
| 335 | Clayton | Contra Costa | 1.23 |
| 336 | Canyon Lake | Riverside | 1.01 |
Cities with 10,000 or more residents that are not ranked
These cities have 10,000 or more residents but are not ranked. A city’s absence from the rankings does not mean it is safe or dangerous.
| City | County | Reason |
|---|---|---|
| Arvin | Kern | No DOJ crime data for 2023 to 2025 |
| Avenal | Kings | Very low crash and crime counts could not be verified |
| Burbank | Los Angeles | 2025 crash counts far below earlier years (2025 is provisional) |
| Calexico | Imperial | Almost no crashes recorded in TIMS |
| Cathedral City | Riverside | DOJ documents gaps in 2023 crime data |
| Coalinga | Fresno | Almost no crashes recorded in TIMS |
| Commerce | Los Angeles | Excluded as an industrial city |
| Costa Mesa | Orange | DOJ crime data missing for October 2023 |
| Culver City | Los Angeles | 2025 crash counts far below earlier years (2025 is provisional) |
| Downey | Los Angeles | No DOJ crime data for 2024 |
| Exeter | Tulare | Almost no crashes recorded in TIMS |
| Folsom | Sacramento | 2025 crash counts far below earlier years (2025 is provisional) |
| Fortuna | Humboldt | Crash counts drop sharply and stay low in TIMS |
| Fountain Valley | Orange | Crash counts drop sharply and stay low in TIMS |
| Garden Grove | Orange | DOJ documents gaps in 2023 crime data |
| Gardena | Los Angeles | Crash counts drop sharply and stay low in TIMS |
| Half Moon Bay | San Mateo | No city-level DOJ crime records |
| Imperial | Imperial | Almost no crashes recorded in TIMS; DOJ documents gaps in 2023 crime data |
| Kerman | Fresno | Very low crash counts could not be verified |
| Larkspur | Marin | Crime reported through a regional police authority |
| Lemon Grove | San Diego | 2025 crash counts far below earlier years (2025 is provisional) |
| Lodi | San Joaquin | No DOJ crime data for 2023 |
| Lomita | Los Angeles | Almost no crashes recorded in TIMS |
| Lompoc | Santa Barbara | DOJ documents gaps in 2023 crime data |
| Los Banos | Merced | Crash counts drop sharply and stay low in TIMS |
| McFarland | Kern | Almost no crashes recorded in TIMS |
| Millbrae | San Mateo | No city-level DOJ crime records |
| Mountain House | San Joaquin | No population history before 2024 |
| Orange | Orange | DOJ documents gaps in 2023 crime data |
| Rancho Palos Verdes | Los Angeles | Almost no crashes recorded in TIMS |
| Rio Vista | Solano | Crash counts drop sharply and stay low in TIMS |
| San Anselmo | Marin | Crime reported through a regional police authority |
| San Carlos | San Mateo | No city-level DOJ crime records |
| Santa Cruz | Santa Cruz | DOJ documents gaps in 2023 crime data |
| Santa Fe Springs | Los Angeles | Excluded as an industrial city |
| Santa Paula | Ventura | 2025 crash counts far below earlier years (2025 is provisional) |
| Shasta Lake | Shasta | No matching city crime records in DOJ data |
| Wasco | Kern | DOJ crime reporting began in June 2024 |
| West Sacramento | Yolo | DOJ documents gaps in 2023 crime data |
| Westminster | Orange | Crash counts drop sharply and stay low in TIMS |
Sources
NHTSA Halloween safety guidance
For questions about the data or methodology, journalists can contact Andrea Nadeau at andrea@getmaisonlaw.com.
