
Table of Contents
Key Takeaways
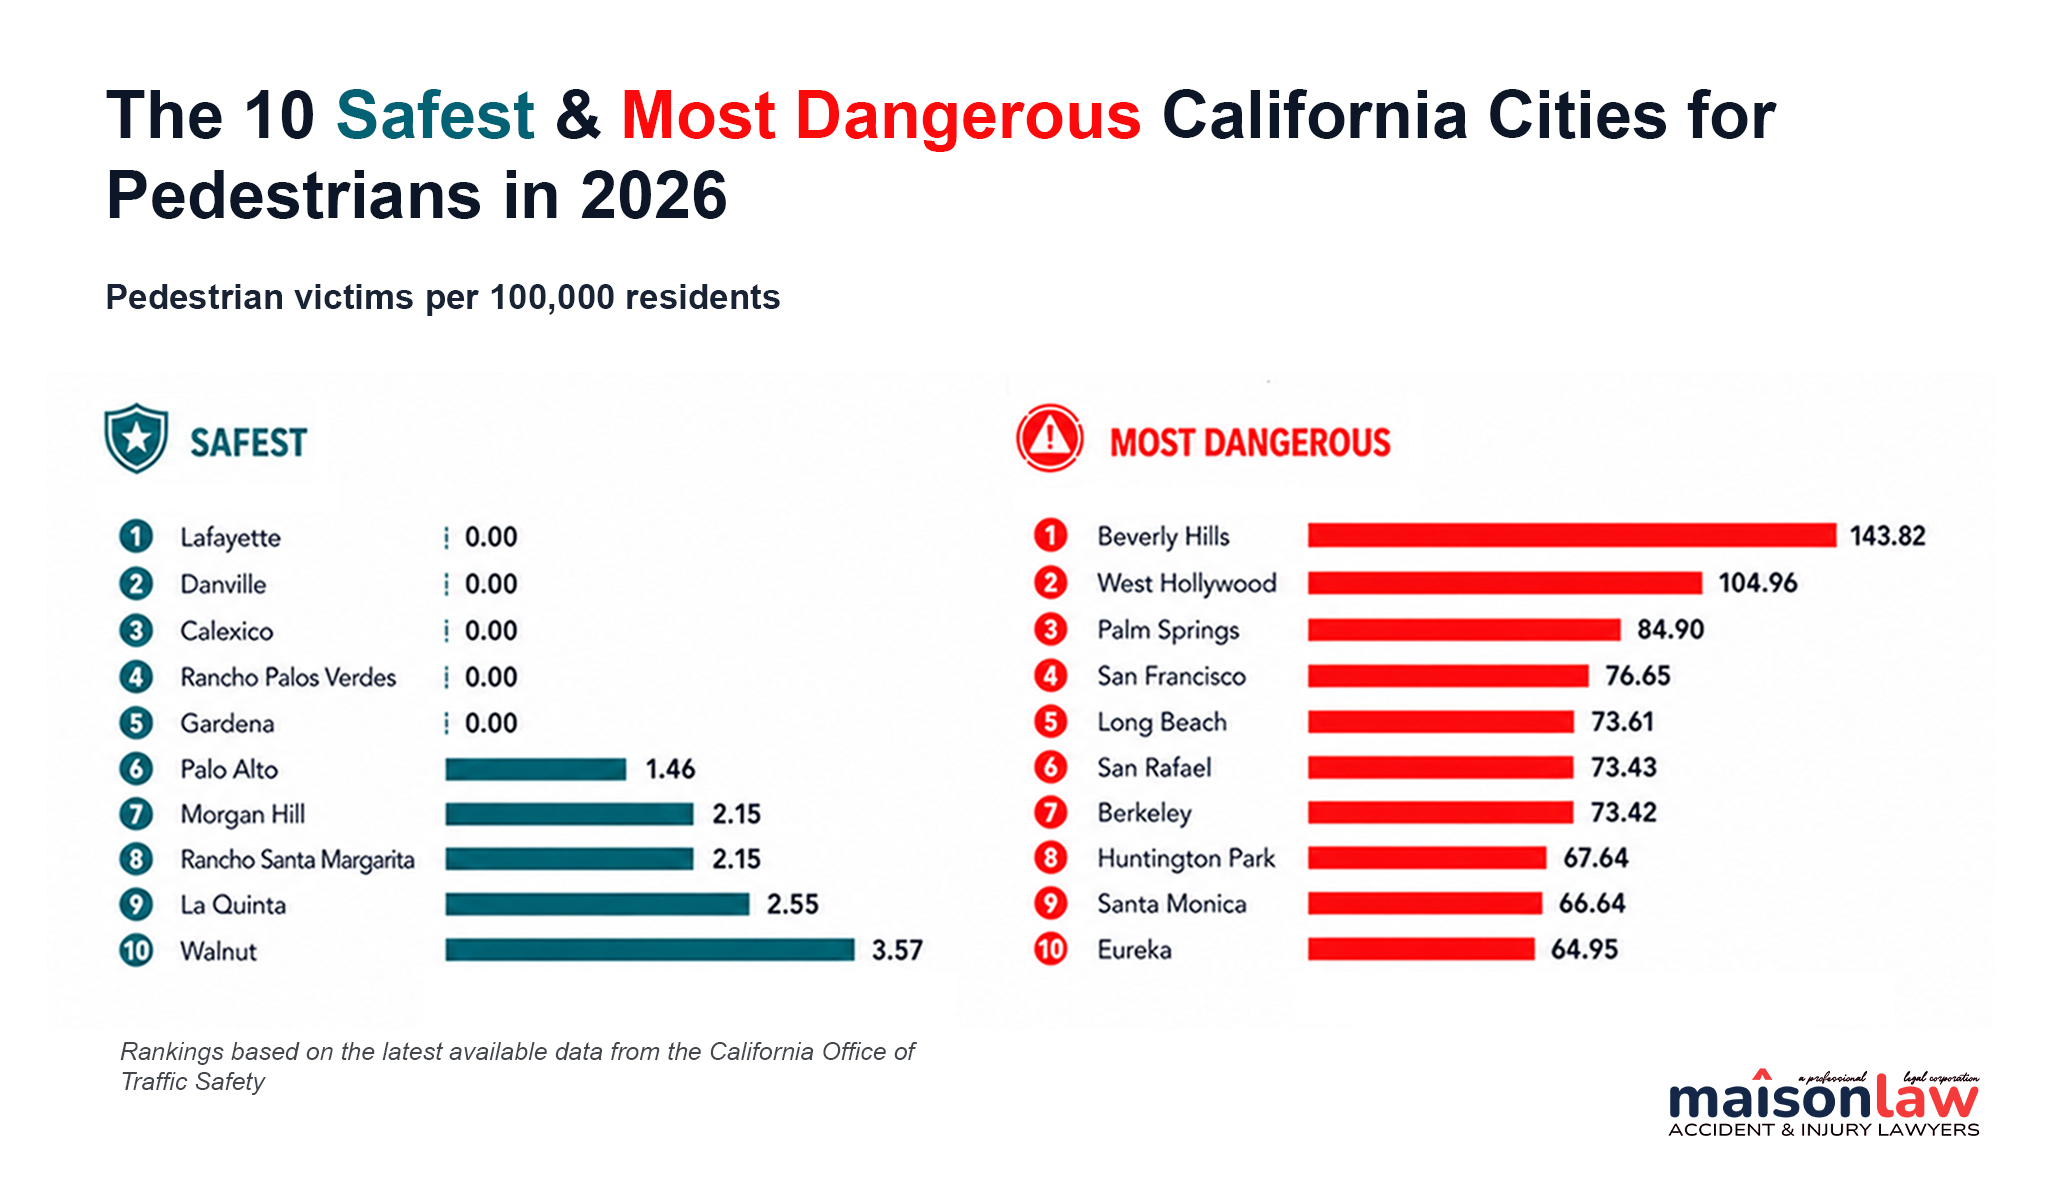
- Beverly Hills is the most dangerous city in California for pedestrians on a per-capita basis with a rate of 143.8 pedestrian victims per 100,000 residents — 37% higher than second-place West Hollywood and about five times the average rate among the cities analyzed.
- West Hollywood ranks second, with 105.0 pedestrian victims per 100,000 residents. It also ranks fifth in our statewide analysis of fatal-and-injury hit-and-run collisions, at 105.0 per 100,000 residents.
- Small cities can be just as dangerous as major metros. Several cities with populations well under 50,000 (including Eureka, San Pablo, Bell, Stanton, and Monterey) rank among the 25 most dangerous cities in the state, ahead of much larger cities like Los Angeles and San Diego.
- Five cities reported zero pedestrian victims in 2023: Lafayette, Danville, Calexico, Rancho Palos Verdes, and Gardena. While this likely reflects genuinely low pedestrian-crash exposure in most of these communities, it may also reflect a data-reporting gap rather than an unusually safe roadway network.
- Senior pedestrian risk overlaps substantially with the overall rankings. Beverly Hills has the highest senior pedestrian victim rate at 34.4 per 100,000, followed by Huntington Park, Palm Springs, San Rafael and Los Gatos. Four of those five cities also rank among the 10 most dangerous cities for pedestrians overall.
- Cyclists face the sharpest risk in coastal and college-adjacent cities. Santa Barbara posts by far the highest cyclist victim rate in the state (152.0 per 100,000) — nearly 50% higher than second-place Huntington Beach.
A Statewide Look at California’s Pedestrian Safety Problem
We pulled 2023 crash data from the California Office of Traffic Safety (OTS) and ranked every incorporated city in the state with a population of 25,000 or more, 270 cities in total, by pedestrian victims per 100,000 residents. OTS publishes its own rankings, but only within population brackets, so a city of 30,000 only ever gets compared to other cities near that size. We wanted a single statewide list. Rank a city of 30,000 against a city of 3 million, and some surprising names rise to the top.
Across the 270 cities analyzed, the 2023 OTS city records total 10,166 pedestrian victims, 7,410 cyclist victims and 119,019 total fatal-and-injury crash victims. The average city in our analysis recorded 28.5 pedestrian victims per 100,000 residents. Beverly Hills’ rate was about five times that average.
The 25 most dangerous cities for pedestrians
Beverly Hills tops the list, followed by nearby West Hollywood at 105.0 pedestrian victims per 100,000 residents. West Hollywood also appears near the top of our separate hit-and-run analysis, ranking fifth for fatal-and-injury hit-and-run collisions per capita.
Palm Springs, San Francisco, Long Beach, San Rafael, and Berkeley round out the top seven. San Francisco’s rate of 76.7 pedestrian victims per 100,000 residents makes it the highest-ranked of California’s 15 largest cities, at roughly 6.5 times Irvine’s rate.
Several names on this list will surprise anyone who assumes danger scales with size. Eureka, a Humboldt County city of about 26,000 people, ranks tenth. San Pablo, population 31,000, ranks eleventh. Bell, Stanton, and Montclair, none with more than 41,000 residents, all crack the top 25. Los Angeles recorded 1,432 pedestrian victims, more than any city in our dataset, but it does not appear among the 25 highest rates once the figures are adjusted for population. Neither does San Diego.
| Rank | City | County | Population | Pedestrian victims | Rate per 100,000 |
|---|---|---|---|---|---|
| 1 | Beverly Hills | Los Angeles | 31,984 | 46 | 143.82 |
| 2 | West Hollywood | Los Angeles | 35,250 | 37 | 104.96 |
| 3 | Palm Springs | Riverside | 44,760 | 38 | 84.90 |
| 4 | San Francisco | San Francisco | 845,355 | 648 | 76.65 |
| 5 | Long Beach | Los Angeles | 460,545 | 339 | 73.61 |
| 6 | San Rafael | Marin | 59,917 | 44 | 73.43 |
| 7 | Berkeley | Alameda | 126,676 | 93 | 73.42 |
| 8 | Huntington Park | Los Angeles | 53,223 | 36 | 67.64 |
| 9 | Santa Monica | Los Angeles | 93,034 | 62 | 66.64 |
| 10 | Eureka | Humboldt | 26,172 | 17 | 64.95 |
| 11 | San Pablo | Contra Costa | 31,450 | 19 | 60.41 |
| 12 | Oakland | Alameda | 424,235 | 255 | 60.11 |
| 13 | Bell | Los Angeles | 33,366 | 20 | 59.94 |
| 14 | Stanton | Orange | 40,576 | 24 | 59.15 |
| 15 | Inglewood | Los Angeles | 106,617 | 63 | 59.09 |
| 16 | Sacramento | Sacramento | 526,327 | 297 | 56.43 |
| 17 | Monterey | Monterey | 27,148 | 15 | 55.25 |
| 18 | Hawthorne | Los Angeles | 85,868 | 47 | 54.74 |
| 19 | Modesto | Stanislaus | 219,705 | 119 | 54.16 |
| 20 | Pasadena | Los Angeles | 140,054 | 75 | 53.55 |
| 21 | Montclair | San Bernardino | 37,670 | 20 | 53.09 |
| 22 | Watsonville | Santa Cruz | 50,860 | 27 | 53.09 |
| 23 | Montebello | Los Angeles | 62,243 | 33 | 53.02 |
| 24 | Seaside | Monterey | 30,299 | 16 | 52.81 |
| 25 | Compton | Los Angeles | 93,699 | 48 | 51.23 |
Eureka’s numbers stand out beyond pedestrian crashes. In OTS’s own population-group rankings, Eureka ranks first out of 93 cities on the agency’s composite traffic-safety measure, which incorporates several crash categories including alcohol involvement, hit-and-run, nighttime and speed-related collisions.
The 25 safest cities for pedestrians
Five cities in the analysis reported zero pedestrian victims in 2023: Lafayette, Danville, Calexico, Rancho Palos Verdes and Gardena. These results should be interpreted cautiously. OTS notes that its rankings are indicators of potential traffic-safety problems and that local circumstances can understate or overstate a city’s apparent risk.
Calexico deserves an additional caveat. Its OTS records show zero victims or collisions across nearly every crash category in both 2022 and 2023. That unusual pattern means its zero pedestrian count should not necessarily be interpreted as proof of an exceptionally safe pedestrian environment.
| Rank | City | County | Population | Pedestrian victims | Rate per 100,000 |
|---|---|---|---|---|---|
| 1 | Lafayette | Contra Costa | 25,073 | 0 | 0.00 |
| 2 | Danville | Contra Costa | 43,030 | 0 | 0.00 |
| 3 | Calexico | Imperial | 39,762 | 0 | 0.00 |
| 4 | Rancho Palos Verdes | Los Angeles | 40,831 | 0 | 0.00 |
| 5 | Gardena | Los Angeles | 60,176 | 0 | 0.00 |
| 6 | Palo Alto | Santa Clara | 68,570 | 1 | 1.46 |
| 7 | Morgan Hill | Santa Clara | 46,573 | 1 | 2.15 |
| 8 | Rancho Santa Margarita | Orange | 46,553 | 1 | 2.15 |
| 9 | La Quinta | Riverside | 39,148 | 1 | 2.55 |
| 10 | Walnut | Los Angeles | 28,008 | 1 | 3.57 |
| 11 | Yucaipa | San Bernardino | 54,561 | 2 | 3.67 |
| 12 | Yorba Linda | Orange | 66,573 | 4 | 6.01 |
| 13 | Foster City | San Mateo | 32,856 | 2 | 6.09 |
| 14 | Coachella | Riverside | 44,050 | 3 | 6.81 |
| 15 | Brawley | Imperial | 28,710 | 2 | 6.97 |
| 16 | Chino Hills | San Bernardino | 77,452 | 6 | 7.75 |
| 17 | Windsor | Sonoma | 25,669 | 2 | 7.79 |
| 18 | Norco | Riverside | 25,581 | 2 | 7.82 |
| 19 | Wildomar | Riverside | 37,060 | 3 | 8.09 |
| 20 | Dublin | Alameda | 73,832 | 6 | 8.13 |
| 21 | Moorpark | Ventura | 35,023 | 3 | 8.57 |
| 22 | Elk Grove | Sacramento | 180,599 | 17 | 9.41 |
| 23 | Lake Elsinore | Riverside | 73,079 | 7 | 9.58 |
| 24 | San Ramon | Contra Costa | 83,245 | 8 | 9.61 |
| 25 | Saratoga | Santa Clara | 31,020 | 3 | 9.67 |
The safest rankings include many suburban communities, while several denser urban centers appear near the top of the dangerous list. However, the data alone cannot establish why individual cities rank where they do. Road design, pedestrian exposure, tourism, commuting patterns and differences in reporting can all affect per-capita figures.
Who’s most at risk, and where
Overall danger and danger to specific groups aren’t the same thing. A city can rank low for pedestrians generally and still be dangerous for children, seniors, or cyclists specifically.
Beverly Hills leads the senior pedestrian rankings too, and not by a small margin. Its rate of 34.4 senior pedestrian victims per 100,000 residents is more than 60% higher than second-place Huntington Park. Palm Springs, San Rafael and Los Gatos round out the top five.
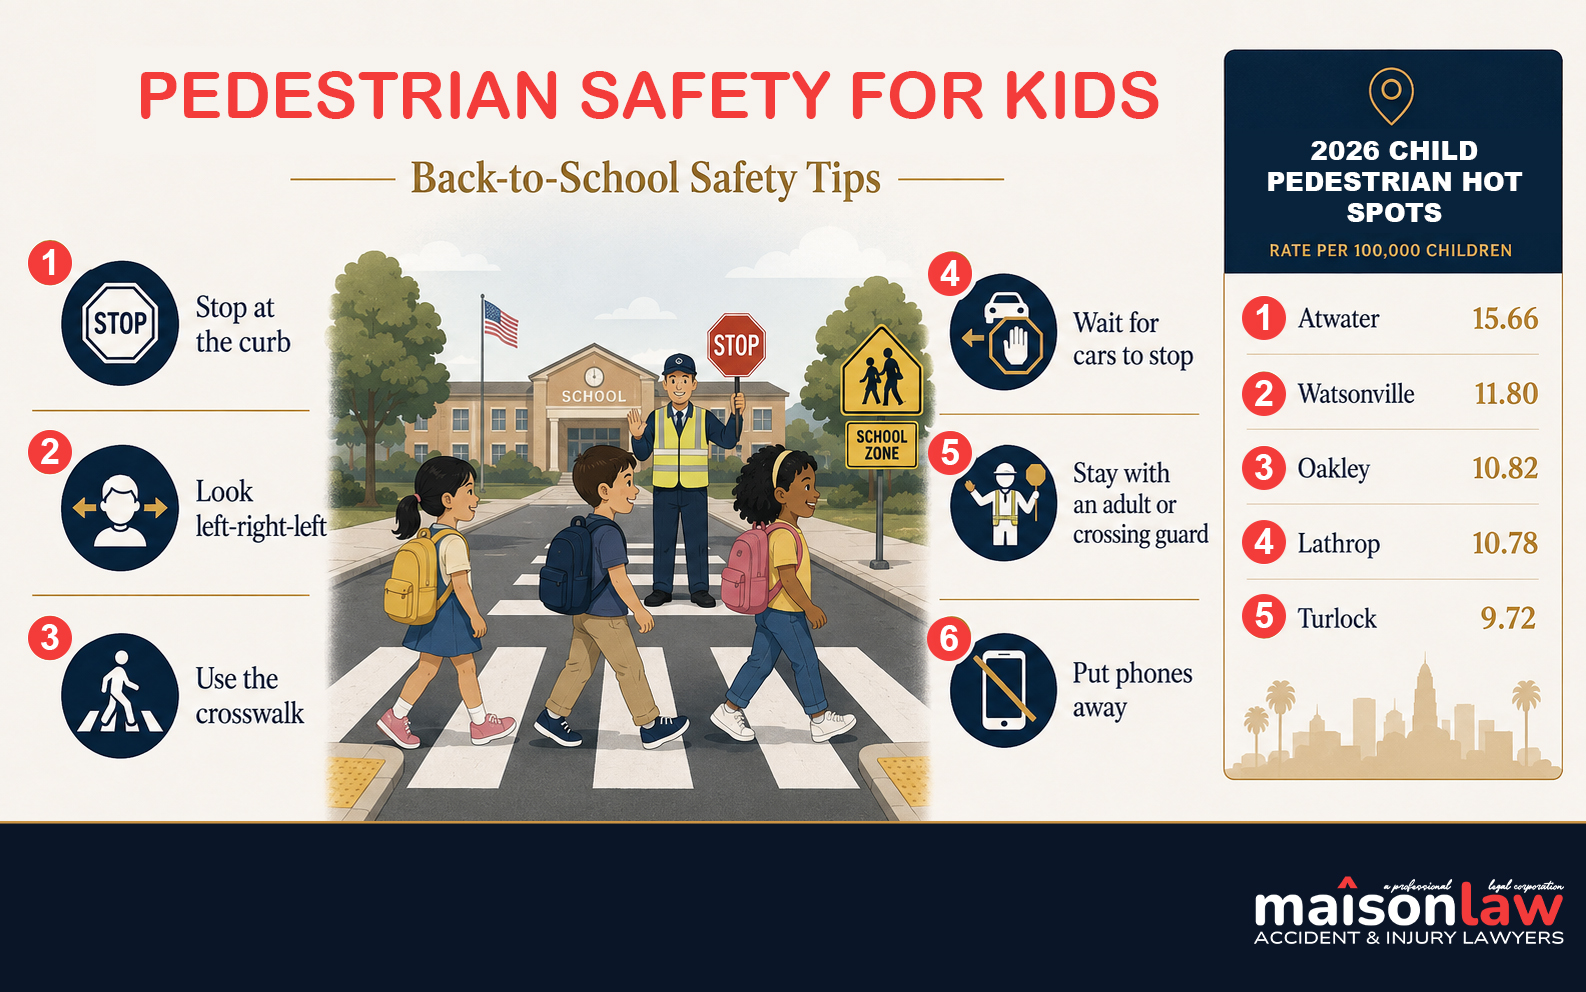
Child pedestrians show a different geography of risk. Atwater, a Merced County city of about 32,000 residents, recorded the highest child pedestrian victim rate in our analysis at 15.66 per 100,000 residents. Watsonville ranks second, followed by Oakley, Lathrop and Turlock. The Central Valley stands out in particular: five of California’s 10 highest child pedestrian victim rates were recorded in Central Valley cities — Atwater, Lathrop, Turlock, Hanford and Los Banos.
Cyclists face their own geography of risk, concentrated almost entirely in coastal and college towns. Santa Barbara recorded the highest cyclist victim rate in the analysis at 152.0 per 100,000 residents, nearly 50% above second-place Huntington Beach. Menlo Park, Santa Cruz and Berkeley complete the top five.
Top 10 cities for cyclist danger
| Rank | City | County | Rate per 100,000 |
|---|---|---|---|
| 1 | Santa Barbara | Santa Barbara | 152.00 |
| 2 | Huntington Beach | Orange | 102.32 |
| 3 | Menlo Park | San Mateo | 92.77 |
| 4 | Santa Cruz | Santa Cruz | 92.27 |
| 5 | Berkeley | Alameda | 83.68 |
| 6 | Costa Mesa | Orange | 80.87 |
| 7 | Carlsbad | San Diego | 80.58 |
| 8 | Newport Beach | Orange | 71.09 |
| 9 | Bell | Los Angeles | 68.93 |
| 10 | Los Gatos | Santa Clara | 68.66 |
Top 10 cities for child pedestrian danger
| Rank | City | County | Rate per 100,000 |
|---|---|---|---|
| 1 | Atwater | Merced | 15.66 |
| 2 | Watsonville | Santa Cruz | 11.80 |
| 3 | Oakley | Contra Costa | 10.82 |
| 4 | Lathrop | San Joaquin | 10.78 |
| 5 | Turlock | Stanislaus | 9.72 |
| 6 | Bell | Los Angeles | 8.99 |
| 7 | Manhattan Beach | Los Angeles | 8.79 |
| 8 | National City | San Diego | 8.49 |
| 9 | Hanford | Kings | 8.35 |
| 10 | Los Banos | Merced | 8.30 |
Top 10 cities for senior pedestrian danger
| Rank | City | County | Rate per 100,000 |
|---|---|---|---|
| 1 | Beverly Hills | Los Angeles | 34.39 |
| 2 | Huntington Park | Los Angeles | 20.67 |
| 3 | Palm Springs | Riverside | 15.64 |
| 4 | San Rafael | Marin | 15.02 |
| 5 | Los Gatos | Santa Clara | 14.93 |
| 6 | Monterey | Monterey | 14.73 |
| 7 | San Francisco | San Francisco | 14.67 |
| 8 | Cypress | Orange | 14.12 |
| 9 | Rosemead | Los Angeles | 13.92 |
| 10 | Pasadena | Los Angeles | 13.57 |
Hit-and-run crashes
Hit-and-run crashes can create additional difficulties for injured people when the driver’s identity or insurance information is not immediately available.
San Pablo and Oakland are nearly tied for the highest fatal-and-injury hit-and-run collision rate in the analysis, both above 117 collisions per 100,000 residents. Sacramento, Long Beach and West Hollywood round out the top five. Eureka appears again at number nine.
| Rank | City | County | Rate per 100,000 |
|---|---|---|---|
| 1 | San Pablo | Contra Costa | 117.65 |
| 2 | Oakland | Alameda | 117.62 |
| 3 | Sacramento | Sacramento | 110.39 |
| 4 | Long Beach | Los Angeles | 107.70 |
| 5 | West Hollywood | Los Angeles | 104.96 |
| 6 | Bell | Los Angeles | 95.91 |
| 7 | East Palo Alto | San Mateo | 92.07 |
| 8 | Stockton | San Joaquin | 89.38 |
| 9 | Eureka | Humboldt | 87.88 |
| 10 | Compton | Los Angeles | 83.25 |
How the big cities stack up against each other
Raw crash counts and per-capita rates tell different stories for large cities. Los Angeles recorded 1,432 pedestrian victims in 2023, the highest total in our dataset. Once adjusted for population, however, its rate of 37.5 per 100,000 falls near the middle of California’s 15 largest cities and below San Francisco, Long Beach, Oakland and Sacramento.
| City | Population | Pedestrian victims | Rate per 100,000 |
|---|---|---|---|
| San Francisco | 845,355 | 648 | 76.65 |
| Long Beach | 460,545 | 339 | 73.61 |
| Oakland | 424,235 | 255 | 60.11 |
| Sacramento | 526,327 | 297 | 56.43 |
| Santa Ana | 313,210 | 157 | 50.13 |
| Bakersfield | 414,451 | 170 | 41.02 |
| Stockton | 323,355 | 129 | 39.89 |
| Los Angeles | 3,819,600 | 1,432 | 37.49 |
| San Diego | 1,394,317 | 522 | 37.44 |
| Fresno | 552,751 | 202 | 36.54 |
| Riverside | 321,538 | 113 | 35.14 |
| San Jose | 980,174 | 314 | 32.04 |
| Anaheim | 342,054 | 96 | 28.07 |
| Chula Vista | 280,840 | 64 | 22.79 |
| Irvine | 316,119 | 37 | 11.70 |
Irvine is the outlier at the bottom of the large-city comparison, with 11.7 pedestrian victims per 100,000 residents — roughly one-sixth San Francisco’s rate.
Staying safe on foot
None of these numbers are inevitable. Most pedestrian crashes involve a handful of repeat factors: a driver who didn’t see the person crossing, low light, a crossing outside a marked intersection, or someone stepping off a curb assuming a driver would stop. A few habits cut that risk substantially, whether you live in Beverly Hills or Bakersfield.
Cross at marked intersections and crosswalks whenever one is available. Drivers are trained to watch those spots. Mid-block crossings, especially on multi-lane roads, are where a large share of serious pedestrian crashes happen, because a driver in the far lane often can’t see a pedestrian until it’s too late to stop.
Make eye contact with drivers before stepping into the street, even when you have the right of way. A driver who’s looking at their phone or turning their head to check a mirror won’t stop just because the law says they should. Wait for a clear signal that they’ve seen you.
Wear something visible after dark. Streetlights and headlights don’t always pick up dark clothing until a driver is dangerously close. A light-colored jacket, a reflective strip on a bag, or a small flashlight when you’re walking a dog or jogging at night all help close that gap.
Don’t assume a stopped car has stopped for you. Drivers stop for traffic, for a light, for a car ahead of them, not always for a pedestrian at the curb. Check that the car has actually yielded, not just slowed, before you step off.
Put the phone away while crossing. A pedestrian looking at a screen misses the exact cues, an accelerating car, a driver who hasn’t seen them, that would otherwise give them time to react.
Back-to-school pedestrian safety
As children return to school, families and drivers can take a few simple steps to reduce risk on walking and biking routes.
Walk the route with your child before they begin traveling it regularly. Identify sidewalks, marked crossings, traffic signals and locations with crossing guards, and talk through what to do at each crossing.
Use marked crosswalks and intersections whenever possible. Younger children should stop at the curb, look left-right-left and wait until vehicles have fully stopped before entering the roadway.
Drivers should slow down and stay off their phones around schools and neighborhoods where children are present, not just during posted school-zone hours.
NHTSA recommends that children age 10 and younger walk with an adult and that children use sidewalks and marked crosswalks whenever available.
Families in cities that ranked highly in our child pedestrian analysis may want to pay particular attention to the walking and biking routes their children use. Atwater recorded California’s highest child pedestrian victim rate in our analysis, while five of the top 10 cities — Atwater, Lathrop, Turlock, Hanford and Los Banos — are in the Central Valley.
How we ran the numbers
We pulled crash-victim data from the California Office of Traffic Safety’s Crash Rankings tool, which reports annual, city-level counts sourced from the CHP’s Statewide Integrated Traffic Records System. 2023 is the most recent year OTS has published complete rankings for.
The analysis covers 270 incorporated California cities with an estimated 2023 population of 25,000 or more. We excluded smaller cities because a handful of incidents in a small population can produce rates that look extreme but reflect only a few crashes. Several smaller cities we pulled data on during research, including Coronado, South El Monte, Maywood, and Laguna Beach, fell under the 25,000 threshold and were excluded from all rankings for this reason.
Our primary metric is pedestrian victims, killed and injured combined, per 100,000 residents, the same normalization used by OTS, NHTSA, and most published traffic safety research, because it allows a fair comparison between cities of very different sizes. We applied the same method to build separate rankings for cyclists, child pedestrians under 15, senior pedestrians 65 and older, and hit-and-run victims.
OTS only ranks cities against similarly sized peers within its own published groupings. We built a single statewide ranking instead so any two cities, regardless of size, can be compared directly.
OTS is clear that its figures indicate potential problem areas rather than precise measures of risk. A single major arterial road, a tourism-heavy downtown, a university, or an unhoused population concentrated in one area can shift a city’s numbers in ways that don’t necessarily reflect the danger of walking there day to day. Figures are also subject to revision as SWITRS records are finalized. We present the data as OTS currently publishes it, without adjustment.
How Maison Law Can Help
Maison Law represents people hurt by negligent drivers throughout California, including pedestrians and cyclists struck in cities at every point on this list. Founding attorney Martin Gasparian has recovered millions of dollars for injury victims, including cases insurance companies initially tried to deny or undervalue.
If you or someone you love was hurt while walking or biking, call us or reach out online. Consultations are free, confidential, and available any time. We represent clients in English, Spanish, and several other languages.
No fee unless you win.
This report is for informational purposes only and does not constitute legal advice. Data source: California Office of Traffic Safety (OTS) Crash Rankings, 2023, the most recent complete year published. Population figures are California Department of Finance estimates as reported by OTS. The analysis covers 270 incorporated California cities with a 2023 population of 25,000 or more; smaller cities were excluded because small numbers of incidents can produce unusually large per-capita rates.
