
When clocks fall back on Sunday, November 1,1 California’s evening commute moves into the dark. In the four weeks after the change, 71% of crashes between 4 p.m. and 8 p.m. happen in darkness. In the four weeks before, about 35% do.
That shift is mostly about sunset. The bigger question is what darkness does to a crash. A new Maison Law analysis of 820,916 crashes that resulted in injury or death2 finds that crashes in the dark are deadlier even at the same time of day. At the same hour, a crash in the dark was 1.7 to 2.0 times as likely to be fatal as a crash in daylight.
Maison Law also compared 173 California cities with 50,000 or more residents3 and ten regions on two measures: the share of crashes that happen in the dark and the share of dark crashes on roads without street lights.
At a Glance
- Evening crashes move into the dark. After clocks fall back, 71% of crashes between 4 p.m. and 8 p.m. happen in darkness, up from about 35% in the four weeks before.
- 32% of crashes, 59% of deaths. Crashes in the dark are 32% of California crashes with injury or death, but 59% of the fatal ones.
- About twice as likely to be fatal. At the same time of day, crashes in the dark were 1.7 to 2.0 times as likely to be fatal as crashes in daylight.
- Pedestrians are the most exposed. About 4 in 5 deadly crashes involving a pedestrian happened in the dark.
- Roads without street lights are deadlier. Crashes in the dark were about twice as likely to be fatal on roads without street lights as where lights worked.
- Winter is darker, not deadlier. California has about the same number of crashes and deaths per day in winter and summer. More of the winter crashes simply happen after sunset.
- Los Angeles has the largest share of crashes in the dark among 173 cities (41.3%). Hesperia has the largest share of dark crashes on roads without street lights (55.5%).
How to Read These Numbers
Every crash in this report resulted in injury or death, as recorded by police. Crashes with only property damage are not included. A fatal (deadly) crash is one in which at least one person died. A crash is in the dark when the police report says it happened in darkness, whether or not street lights were on. Dusk and dawn are counted separately.
The dark share is the percentage of crashes that happened in the dark. It shows when crashes happen, not whether darkness is more dangerous there. An unlit road is one where the report says there were no street lights, and the unlit-road share is the share of crashes in the dark that happened on such roads. Figures cover 2021 through 2025, and numbers for 2025 are preliminary and may change.
Crashes in the Dark Are Deadlier, Even at the Same Time of Day
Crashes in the dark are deadlier, and the gap holds even when we compare crashes at the same time of day. Crashes in the dark are 32% of California’s crashes with injury or death, but 59% of the fatal ones.
- About twice as likely to be fatal. At the same time of day, crashes in the dark were 1.7 to 2.0 times as likely to be fatal as crashes in daylight.
- Widest gap before dawn. Crashes were more often fatal in the dark in every hour we checked, and the gap narrows through the evening.
- The raw numbers. About 4.3% of crashes in the dark were fatal, against 1.3% in daylight.
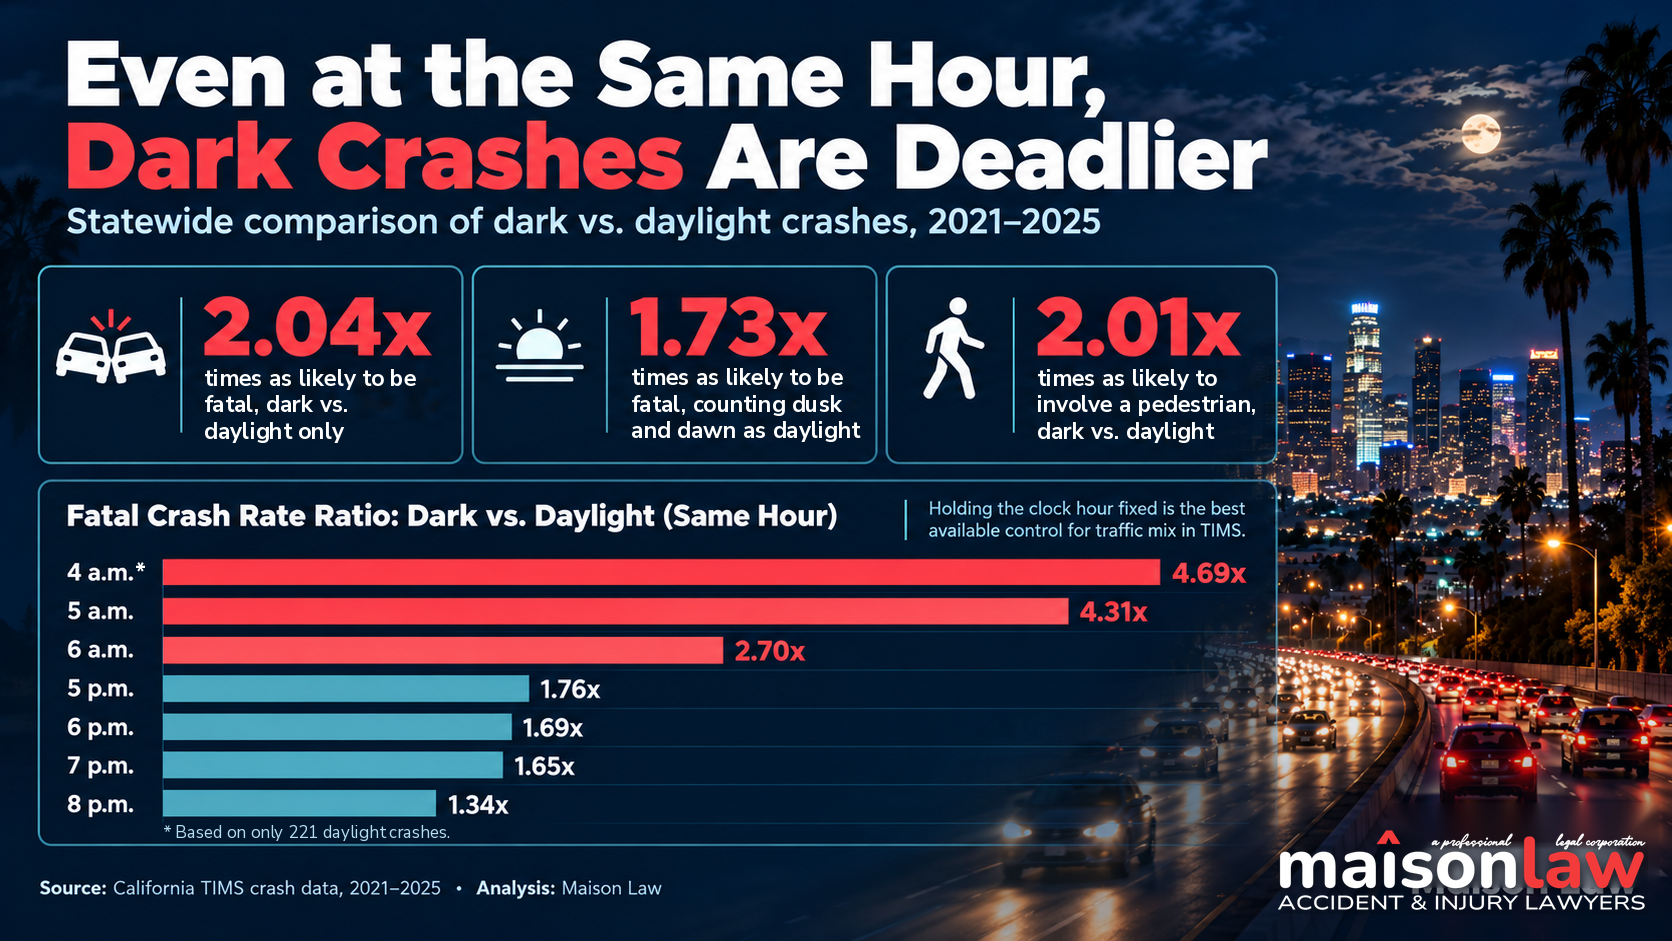
That raw gap overstates what darkness does. Roads carry different traffic at night, with more late-night driving, more drinking and fewer commuters. A simple comparison mixes darkness with who is on the road.
A fairer test compares crashes at the same time of day. Around sunrise and sunset, a given hour is dark on some days of the year and light on others, while traffic stays similar. Maison Law compared dark and daylight crashes within each hour.
Share of Crashes That Were Fatal, by Time of Day
| Time of day | Fatal share of crashes in the dark | Fatal share of crashes in daylight | Dark vs. daylight |
|---|---|---|---|
| 5 to 6 a.m. | 5.9% | 1.4% | 4.3x |
| 6 to 7 a.m. | 4.9% | 1.8% | 2.7x |
| 5 to 6 p.m. | 2.1% | 1.2% | 1.8x |
| 6 to 7 p.m. | 2.7% | 1.6% | 1.7x |
| 7 to 8 p.m. | 3.2% | 1.9% | 1.7x |
| 8 to 9 p.m. | 3.5% | 2.6% | 1.3x |
Above table: Statewide crashes with injury or death, 2021 through 2025.2 These are the hours when, depending on the time of year, between 5% and 95% of crashes happened in the dark. The 4 a.m. hour is left out because it has only 221 daylight crashes.
A statistical model that accounts for time of day, month and day of week puts a number on the gap. Crashes in the dark were 2.0 times as likely to be fatal as crashes in daylight (very likely between 1.9 and 2.2).
How dusk and dawn are handled changes the answer slightly. Crashes at dusk and dawn, when the sky is dim, are themselves more often fatal than daylight crashes (2.6% against 1.3%). The 2.0 figure compares dark crashes with daylight crashes only. If dusk and dawn crashes are added to the daylight group, the figure is 1.7 times (very likely between 1.6 and 1.9).
This is still not a perfect test. The data has no traffic counts, and people driving in the dark may differ from daytime drivers in ways the data cannot show.
Pedestrians Face the Greatest Danger in the Dark
Pedestrians face the greatest danger. Of 5,582 crashes involving a pedestrian in which someone died, 4,469 (about 80%) happened in the dark, even though only 46% of all crashes involving a pedestrian did. These are statewide figures for 2021 through 2025.
- Far deadlier. Crashes involving a pedestrian were fatal 16.9% of the time in the dark, against 3.1% in daylight.
- A large share of deadly dark crashes. Pedestrians were involved in 40% of fatal crashes in the dark, against about 13% in daylight.
- Twice as likely to involve a pedestrian. At the same time of day, a crash in the dark was about twice as likely to involve a pedestrian as a crash in daylight.
The pattern holds hour by hour. Depending on the hour, pedestrians were involved in 1.6 to 3.1 times as large a share of crashes in the dark as in daylight. Across the hours when light changes with the seasons, a crash in the dark was about twice as likely to involve a pedestrian (very likely between 1.9 and 2.1).
Evening pedestrian crashes also climb as sunsets move earlier. Compared with midday crashes (10 a.m. to 3 p.m.), crashes involving a pedestrian between 4 p.m. and 8 p.m. rose about 24% in the four weeks before the fall clock change and about 17% in the four weeks after. Year-to-year swings are large, but the rise before the change points to earlier sunsets, not the clock.
National research points the same way. A 2025 study in the Journal of Safety Research by researchers at the Insurance Institute for Highway Safety, a nonprofit research group, used national data from 2010 through 2019.4 It found deadly crashes involving pedestrians and bicyclists rose 13% in the five weeks after the fall time change, while deadly crashes among vehicle occupants fell 7.1%.
Roads Without Street Lights Add Risk
Street lighting matters. Statewide, crashes in the dark were fatal 6.4% of the time on roads with no street lights, against 3.3% where street lights were working.
- About twice as likely to be fatal. After accounting for the time of day, state highways, pedestrians, alcohol and year, crashes on roads without street lights were about twice as likely to be fatal (very likely between 2.0 and 2.1).
- Broken street lights. Crashes where street lights were not working are rare, with 1,951 statewide. They were more than twice as likely to be fatal as crashes where lights worked.
- Hesperia leads the cities. More than half of Hesperia’s crashes in the dark (55.5%) happened on roads without street lights.
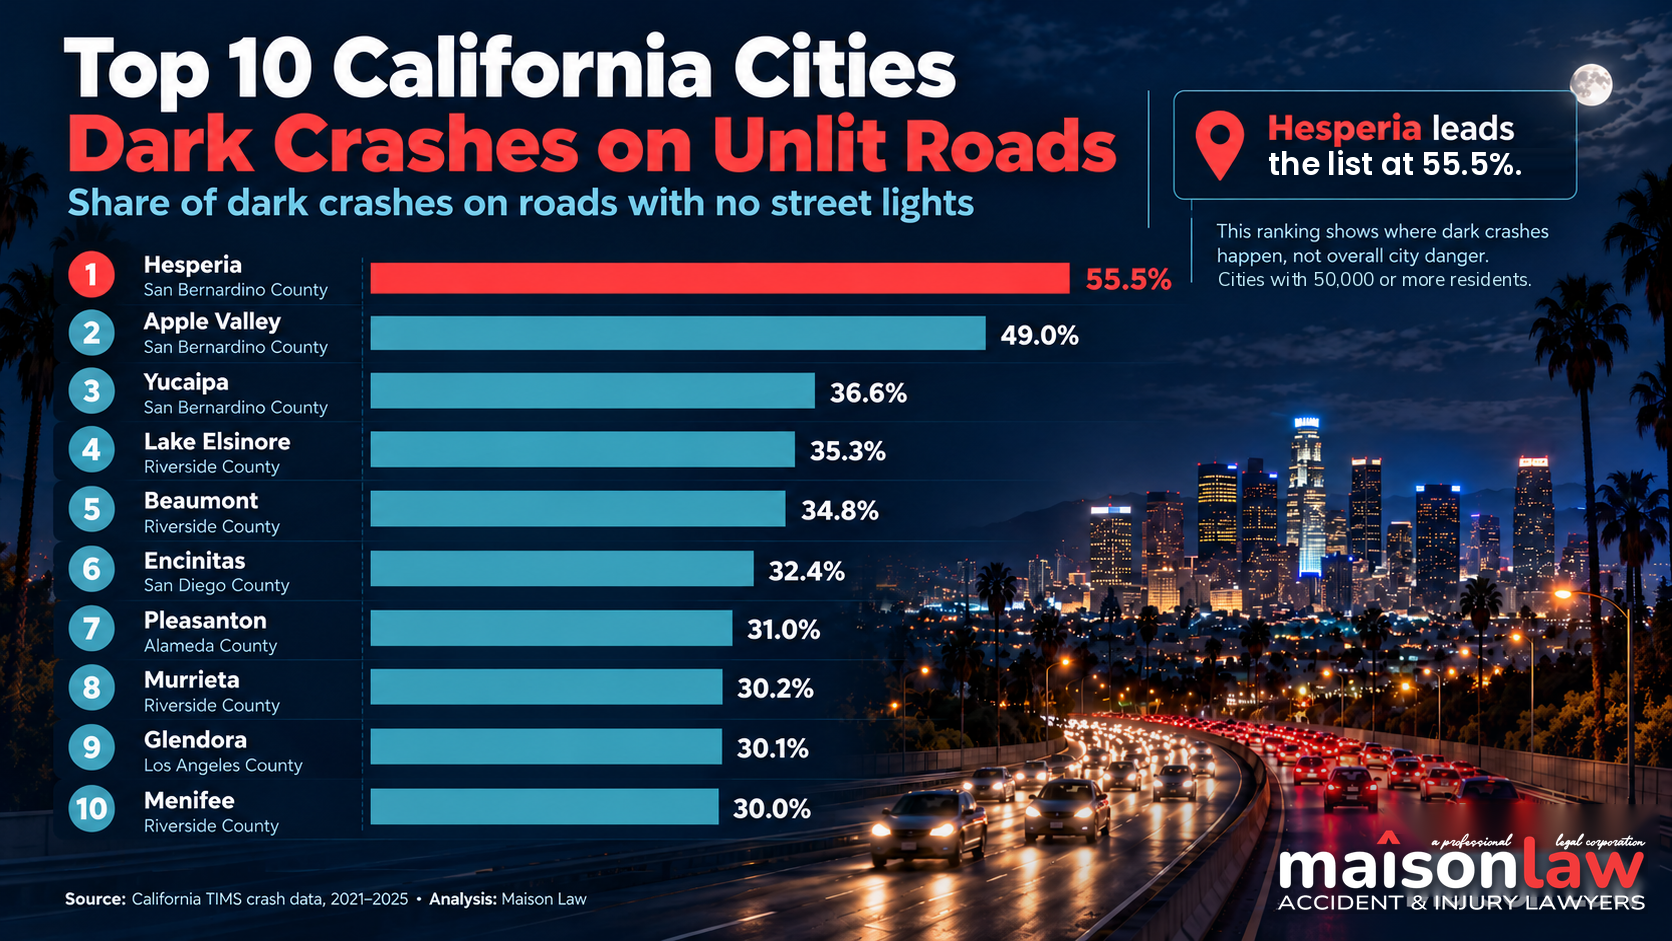
That does not prove missing lights caused the difference. Roads without lights also differ in speed, design and location, and some communities limit street lighting by design. The list below does not measure how much traffic uses those roads.
Top 25 Cities for the Share of Dark Crashes on Roads Without Street Lights
| Rank | City | County | Share of dark crashes on unlit roads | Dark crashes on unlit roads | Crashes in the dark |
|---|---|---|---|---|---|
| 1 | Hesperia | San Bernardino | 55.5% | 482 | 868 |
| 2 | Apple Valley | San Bernardino | 49.0% | 174 | 355 |
| 3 | Yucaipa | San Bernardino | 36.6% | 85 | 232 |
| 4 | Lake Elsinore | Riverside | 35.3% | 125 | 354 |
| 5 | Beaumont | Riverside | 34.8% | 69 | 198 |
| 6 | Encinitas | San Diego | 32.4% | 101 | 312 |
| 7 | Pleasanton | Alameda | 31.0% | 117 | 378 |
| 8 | Murrieta | Riverside | 30.2% | 152 | 504 |
| 9 | Glendora | Los Angeles | 30.1% | 90 | 299 |
| 10 | Menifee | Riverside | 30.0% | 120 | 400 |
| 11 | Diamond Bar | Los Angeles | 29.7% | 152 | 512 |
| 12 | Jurupa Valley | Riverside | 29.4% | 298 | 1,014 |
| 13 | Davis | Yolo | 28.4% | 64 | 225 |
| 14 | Manteca | San Joaquin | 27.8% | 105 | 378 |
| 15 | Milpitas | Santa Clara | 27.7% | 107 | 386 |
| 16 | Redding | Shasta | 27.5% | 103 | 375 |
| 17 | Fairfield | Solano | 27.4% | 287 | 1,048 |
| 18 | Tulare | Tulare | 26.9% | 32 | 119 |
| 19 | Temecula | Riverside | 26.8% | 174 | 650 |
| 20 | Alhambra | Los Angeles | 26.2% | 111 | 424 |
| 21 | Delano | Kern | 26.2% | 28 | 107 |
| 22 | Camarillo | Ventura | 25.8% | 84 | 325 |
| 23 | West Sacramento | Yolo | 25.6% | 103 | 402 |
| 24 | Novato | Marin | 25.3% | 55 | 217 |
| 25 | Lincoln | Placer | 25.0% | 23 | 92 |
Above table: Share of crashes in the dark that happened where there were no street lights, 2021 through 2025, among cities with 50,000 or more residents.2 This describes where crashes happened, not how dangerous a city’s roads are overall.
Hesperia recorded 482 crashes on roads without street lights out of 868 in the dark. Apple Valley recorded 174 out of 355 (49.0%). Wildomar, a smaller city with fewer than 50,000 residents, has a higher share than either, at 58.5%.
What Happens to California Crashes When Clocks Fall Back?
The amount of daylight does not change on November 1. Its place on the clock does. Sunset arrives an hour earlier by the clock, which pushes more of the evening commute into the dark.
- Evening crashes move into the dark. After the fall change, 71% of crashes between 4 p.m. and 8 p.m. happen in the dark, up from 35% in the four weeks before. After the spring change, it falls from 48% to 14%.
- Crashes in the dark rise even as total crashes fall. After the fall change, crashes in the dark rose 16.6% a day while all crashes fell 7.2%.
- No clear sign the clock change itself causes more crashes. Normal seasonal patterns could explain most or all of the difference.
Maison Law compared the four weeks before and after each clock change from 2021 through 2025. “Evening” means 4:00 to 7:59 p.m. The fall change moved evening crashes into the dark in every one of the five years, and the spring change did the reverse.
| Measure | Fall back (November) | Spring forward (March) |
|---|---|---|
| Share of evening crashes in the dark, 4 weeks before | 35.3% | 48.3% |
| Share of evening crashes in the dark, 4 weeks after | 71.4% | 14.1% |
| Change in crashes in the dark per day (all hours) | +16.6% | −16.8% |
| Change in all crashes per day | −7.2% | +3.0% |
Above table: Averages of five yearly comparisons, 2021 through 2025.2
The shift is about the sun. The same evening trips now end after sunset, and sunsets also move earlier through October and November whether or not clocks change.
Maison Law found no clear sign that the clock change itself causes more crashes. After the fall change, evening crashes rose about 5.5% compared with midday crashes (10 a.m. to 3 p.m.), which the time change does not affect. A comparison period with no clock change showed a 3.7% rise, so normal seasonal patterns could explain most or all of it.
The spring change looks different, but not conclusively. After clocks spring forward, evening crashes fell about 11% against midday crashes, compared with a 3% drop in a period with no clock change. That is suggestive, but five years of data is not enough to settle it.
Winter Is Darker, Not Deadlier
December has about twice as many crashes in the dark as June, but about the same number of crashes and deaths overall. Winter shifts crashes into the dark without adding any.
- December against June. 46% of December crashes happened in the dark, against 24% in June.
- Whole-season averages. From December through February, California averages 422 crashes and 10.0 fatal crashes a day. From June through August, it averages 450 and 10.6.
| Per day, 2021 through 2025 | December | June |
|---|---|---|
| All crashes | 453 | 446 |
| Crashes in the dark | 209 | 105 |
| Fatal crashes | 10.2 | 10.4 |
| Fatal crashes in the dark | 7.1 | 5.3 |
The share peaks at 46% in December because sunset arrives hours earlier. That pattern says nothing by itself about how dangerous darkness is.
Which Cities Have the Largest Share of Crashes in the Dark?
Among cities with 50,000 or more residents, Los Angeles has the largest share of crashes in the dark (41.3%), followed closely by Cathedral City (41.1%). But the share shows when a city’s crashes happen, not whether darkness is more dangerous there.
- Highest shares. Los Angeles (41.3%), Cathedral City (41.1%) and Pittsburg (38.9%).
- Lowest shares. Cupertino (18.8%), Palm Desert (21.7%) and Redding (22.6%).
- A smaller city tops the list. Adelanto, which has fewer than 50,000 residents, has a higher share (46.0%).
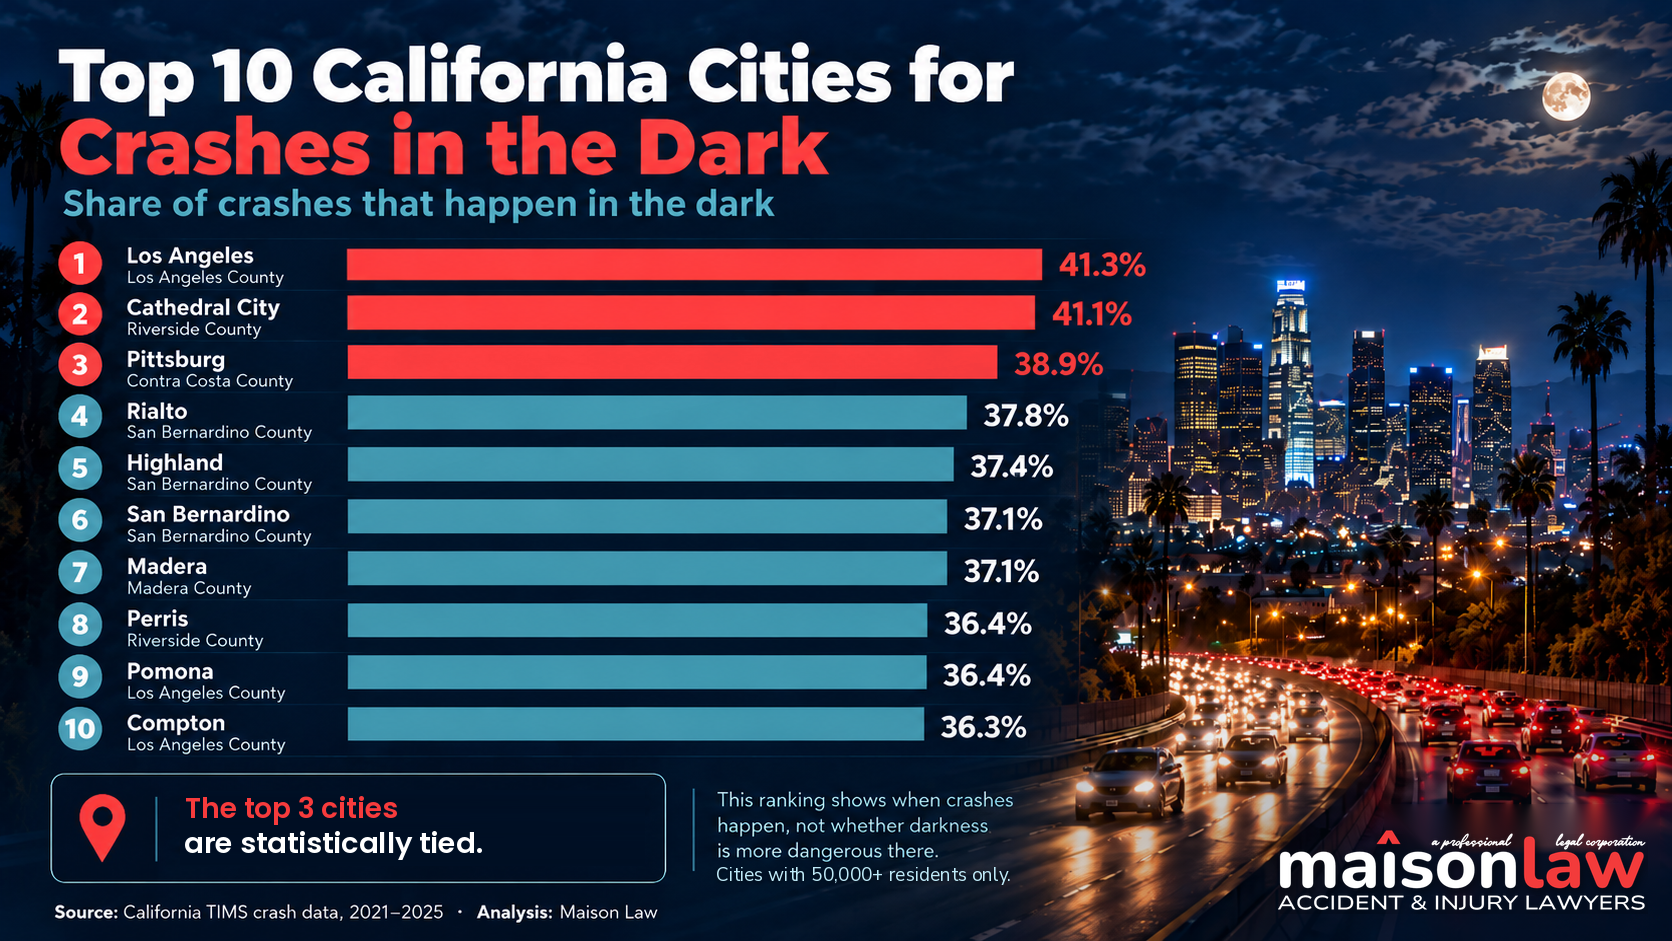
A high share points to a night-heavy crash pattern, such as more late-night driving. A low share points to crashes concentrated in daytime commuting hours. To test this, Maison Law used the statewide share of dark crashes for each hour and month to predict every city’s share from the hours its own crashes happened. The predictions typically landed within about one percentage point of the real figure, a very close match.
Top 25 Cities for the Share of Crashes in the Dark
| Rank | City | County | Share of crashes in the dark | Crashes in the dark | Total crashes |
|---|---|---|---|---|---|
| 1 | Los Angeles | Los Angeles | 41.3% | 24,089 | 58,258 |
| 2 | Cathedral City | Riverside | 41.1% | 219 | 533 |
| 3 | Pittsburg | Contra Costa | 38.9% | 358 | 920 |
| 4 | Rialto | San Bernardino | 37.8% | 826 | 2,187 |
| 5 | Highland | San Bernardino | 37.4% | 327 | 875 |
| 6 | San Bernardino | San Bernardino | 37.1% | 2,428 | 6,539 |
| 7 | Madera | Madera | 37.1% | 322 | 868 |
| 8 | Perris | Riverside | 36.4% | 541 | 1,485 |
| 9 | Pomona | Los Angeles | 36.4% | 1,750 | 4,812 |
| 10 | Compton | Los Angeles | 36.3% | 775 | 2,134 |
| 11 | Antioch | Contra Costa | 36.2% | 488 | 1,347 |
| 12 | Pico Rivera | Los Angeles | 36.2% | 327 | 904 |
| 13 | Hawthorne | Los Angeles | 35.6% | 559 | 1,572 |
| 14 | Vista | San Diego | 35.5% | 519 | 1,463 |
| 15 | Indio | Riverside | 35.3% | 327 | 926 |
| 16 | Jurupa Valley | Riverside | 35.3% | 1,014 | 2,875 |
| 17 | San Francisco | San Francisco | 35.1% | 5,860 | 16,708 |
| 18 | Vallejo | Solano | 35.1% | 809 | 2,307 |
| 19 | Daly City | San Mateo | 34.8% | 453 | 1,300 |
| 20 | Lodi | San Joaquin | 34.8% | 231 | 664 |
| 21 | Anaheim | Orange | 34.8% | 3,666 | 10,543 |
| 22 | Norwalk | Los Angeles | 34.5% | 731 | 2,117 |
| 23 | San Diego | San Diego | 34.5% | 9,807 | 28,415 |
| 24 | San Jacinto | Riverside | 34.5% | 325 | 943 |
| 25 | Long Beach | Los Angeles | 34.3% | 4,752 | 13,844 |
Above table: Share of crashes in the dark among cities with 50,000 or more residents, 2021 through 2025.2 Los Angeles is statistically tied with Cathedral City and Pittsburg. Small gaps in rank are not meaningful.
How Regions Compare
For outlets that cover more than one city, Maison Law grouped California’s 58 counties into ten regions. These figures include every crash in each region’s counties, including unincorporated areas and highways, so they differ from the city rankings.2 Los Angeles County has the largest share of crashes in the dark. Outside the big cities, the San Joaquin Valley and rural areas have far more dark crashes on roads without street lights.
- Los Angeles County leads. 34.2% of its crashes happened in the dark, and 67.2% of its fatal crashes.
- Inland Empire. 85.4% of its fatal crashes involving a pedestrian happened in the dark, the highest of any region. It also has many roads without street lights.
- San Joaquin Valley. Across its eight counties, 46.7% of dark crashes were on roads without street lights, against 15.3% in its 15 larger cities.
- Orange County. Only 10.9% of its dark crashes were on roads without street lights, the lowest of any region.
As with cities, a higher share of crashes in the dark (the “dark share”) shows when crashes happen, not whether darkness is more dangerous there.
Crashes in the Dark by Region
| Region | Counties | Crashes in the dark | Share of crashes in the dark | Share of dark crashes on unlit roads | Share of fatal crashes in the dark | Share of fatal pedestrian crashes in the dark |
|---|---|---|---|---|---|---|
| Los Angeles County | 1 | 70,469 | 34.2% | 16.5% | 67.2% | 79.5% |
| Orange County | 1 | 18,823 | 30.1% | 10.9% | 63.1% | 78.8% |
| San Diego County | 1 | 22,207 | 32.8% | 27.3% | 60.8% | 79.5% |
| Inland Empire | 2 | 35,251 | 33.6% | 34.1% | 61.5% | 85.4% |
| Ventura County | 1 | 5,027 | 27.7% | 24.9% | 50.0% | 68.9% |
| Bay Area | 9 | 42,191 | 30.2% | 24.0% | 56.7% | 72.5% |
| Sacramento Region | 4 | 17,389 | 30.1% | 27.4% | 55.7% | 77.6% |
| San Joaquin Valley | 8 | 31,962 | 32.5% | 46.7% | 58.7% | 84.8% |
| Central Coast | 5 | 8,555 | 28.4% | 47.2% | 51.0% | 77.2% |
| Rest of California | 26 | 10,457 | 30.8% | 69.6% | 44.7% | 80.7% |
| California | 58 | 262,331 | 32.0% | 28.3% | 59.3% | 80.1% |
Above table: Fatal pedestrian crashes are crashes involving a pedestrian in which someone died. The counts are small in some regions (61 in Ventura County, 136 on the Central Coast), so those shares swing.
Los Angeles, Orange, San Diego and Ventura counties stand alone. The Inland Empire is Riverside and San Bernardino counties. The Bay Area is Alameda, Contra Costa, Marin, Napa, San Francisco, San Mateo, Santa Clara, Solano and Sonoma counties. The Sacramento Region is Sacramento, Placer, El Dorado and Yolo counties. The San Joaquin Valley is Fresno, Kern, Kings, Madera, Merced, San Joaquin, Stanislaus and Tulare counties. The Central Coast is Monterey, San Benito, Santa Cruz, San Luis Obispo and Santa Barbara counties. Rest of California is the other 26 counties.
City figures below are for the 173 cities with 50,000 or more residents.
Los Angeles County. The county has the largest dark share (34.2%) and the highest share of fatal crashes in the dark (67.2%). Among its 36 cities, Los Angeles (41.3%) is first in the state, followed by Pomona (36.4%) and Compton (36.3%). Glendora (23.7%) and Pasadena (26.1%) have the smallest dark shares. Glendora (30.1%), Diamond Bar (29.7%) and Alhambra (26.2%) have the largest shares of dark crashes on unlit roads.
Inland Empire. A high dark share (33.6%) pairs with many roads without street lights (34.1% of dark crashes). Cathedral City (41.1%), Rialto (37.8%) and Highland (37.4%) lead its 31 cities on dark share. Hesperia (55.5%), Apple Valley (49.0%) and Yucaipa (36.6%) are first, second and third in the state for dark crashes on unlit roads.
San Diego County. The dark share is 32.8%. Vista (35.5%), San Diego (34.5%) and Chula Vista (33.4%) have the largest dark shares among its 13 cities. Encinitas has the largest share of dark crashes on unlit roads (32.4%).
San Joaquin Valley. The unlit roads are mostly outside the cities. Across the valley’s eight counties, 46.7% of dark crashes were on unlit roads, against 15.3% in its 15 cities. Fatal pedestrian crashes there are also concentrated in the dark (84.8%). Madera (37.1%) and Lodi (34.8%) lead its cities on dark share, and Manteca (27.8%) leads on unlit roads.
Orange County. Only 10.9% of dark crashes were on unlit roads, the lowest of any region. Anaheim (34.8%), Buena Park (32.8%) and Fullerton (31.4%) have the largest dark shares among its 18 cities.
Bay Area. The dark share (30.2%) is below the state’s. Pittsburg (38.9%), Antioch (36.2%) and San Francisco (35.1%) lead its 37 cities, and Cupertino (18.8%) and Mountain View (23.0%) are lowest. Pleasanton (31.0%), Milpitas (27.7%) and Fairfield (27.4%) have the largest shares of dark crashes on unlit roads. Fatal pedestrian crashes are less concentrated in the dark (72.5%) than in every region but Ventura County.
Sacramento Region. The dark share is 30.1%. The city of Sacramento (31.6%) ranks 60th of 173. Davis (28.4%) and West Sacramento (25.6%) have the largest shares of dark crashes on unlit roads among its 10 cities.
Central Coast and Ventura County. These have the lowest dark shares, at 28.4% and 27.7%. On the Central Coast, 47.2% of dark crashes were on unlit roads. Santa Maria (31.6%) and Salinas (31.5%) lead its five cities, and Oxnard (31.9%) leads Ventura County’s five.
Rest of California. The rest of the state is mostly rural. In the other 26 counties, 69.6% of dark crashes were on unlit roads, and only 44.7% of fatal crashes were in the dark, the lowest of any region. Only three cities there have 50,000 or more residents: Chico, Redding and Yuba City.
Late Nights, Alcohol and Weekends
The most severe crashes cluster overnight, and crashes involving alcohol are concentrated in the dark. Three patterns stand out.
- Overnight crashes are far more often fatal. From midnight to 5 a.m., 5% to 6% of crashes in most hours were fatal. Around midday, 1.2% to 1.4% were.
- Crashes involving alcohol cluster in the dark. About 66% of crashes involving alcohol happened in darkness, against about 27% of crashes without alcohol. That does not mean alcohol was involved in 66% of dark crashes. It means crashes involving alcohol are concentrated after dark.
- Weekend crashes shift into the small hours. From midnight to 3 a.m., California averages two to nearly three times as many crashes a day on weekends as on weekdays, and fewer on weekend mornings. That lifts the weekend dark share to 41%, against 29% on weekdays. The hours of those crashes predict the gap almost exactly, so it reflects when people drive, not an effect of darkness.
Will California Stop Changing Its Clocks?
Congress has moved closer to ending clock changes, but nothing has changed yet. On July 14, 2026, the U.S. House passed the Sunshine Protection Act, which would make daylight saving time permanent, by a vote of 308 to 117.5 The bill is now with the Senate Commerce Committee. It is not law, so clocks still fall back at 2 a.m. on Sunday, November 1.1
California voters approved Proposition 7 in 2018,6 which gave the Legislature a path to change the state’s daylight saving rules. It did not end the clock changes on its own. Making daylight saving time permanent would still need approval from Congress, while year-round standard time would not. California follows the federal schedule statewide, unlike Hawaii and most of Arizona, which stay on standard time all year.1
Maison Law’s findings show how sharply evening light shifts when clocks fall back. They do not show which time policy would produce the fewest injuries. Permanent daylight saving time would keep winter evenings lighter and winter mornings darker, a trade-off that matters most for pedestrians, students and commuters near sunrise and sunset.
How to Stay Safer on California Roads After the Time Change
The Automobile Club of Southern California, a AAA club, warns that the fall change can disrupt sleep and cause drowsy driving. It adds that people outdoors are harder to see on darker evening commutes, and that morning sun glare is another hazard.7 These steps help drivers and pedestrians adjust.
- Slow down when visibility drops. Lower speeds give you more time to spot pedestrians, cyclists and hazards.
- Watch crosswalks and intersections. Look for pedestrians before turning, especially during the evening commute.
- Check your headlights. Working, clean, properly aimed lights help you see and be seen.
- Do not drive impaired or drowsy. Alcohol shows up far more often in crashes in the dark, and AAA research found that missing one or two hours of sleep can nearly double crash risk.7
- Make yourself visible on foot or by bike. Wear reflective gear, carry a light and make eye contact with drivers when you cross.
Methodology
Data source. We analyzed 820,916 crashes reported in California from 2021 through 2025 that resulted in injury or death. They come from the Transportation Injury Mapping System (TIMS),2 a UC Berkeley database of California Highway Patrol crash records. The data covers all 58 counties, including unincorporated areas. Records for 2025 are preliminary and may change.
What counts as “in the dark.” A crash counts as dark when the police report says darkness with street lights on, darkness with no street lights, or darkness with street lights not working. Dusk and dawn are not counted as dark. The 2,053 crashes with unknown lighting are left out of every share and comparison.
Same-time-of-day comparison. We compared dark and daylight crashes within the same hour of the day, using the seven hours when between 5% and 95% of crashes happened in the dark (4, 5 and 6 a.m. and 5 through 8 p.m.). A statistical model (logistic regression) held hour, month and day of week constant. Results are reported as odds ratios. When an outcome is rare, as fatal crashes are, an odds ratio of 2.0 is close to “twice as likely.” “Very likely between” refers to a 95% confidence interval. The data has no traffic counts, so the comparison cannot rule out differences between day and night drivers.
Street light analysis. The same kind of model compared crashes in the dark on roads with no street lights against crashes where lights worked. It held constant the hour of day, state highways, pedestrian involvement, alcohol involvement and year.
Clock change analysis. We compared the 28 days before and after each fall and spring change from 2021 through 2025. “Evening” is 4:00 to 7:59 p.m. We compared evening crashes with midday crashes (10:00 a.m. to 2:59 p.m.), which the change does not affect, and with an earlier period when no clock change took place. These comparisons describe patterns. They do not show that the clock change caused differences in crashes.
City rankings. Cities are the 173 with 2025 populations of 50,000 or more, using California Department of Finance E-5 estimates.3 Smaller cities are not ranked, and some post higher figures than the leaders. We ranked two measures: the dark share, the percentage of crashes with a recorded lighting condition that happened in the dark, and the unlit-road share, the percentage of crashes in the dark that happened where there were no street lights.
Per-resident rates are not featured. We also calculated crashes per 100,000 residents, including crashes in the dark and crashes involving pedestrians in the dark. Those rates closely track each city’s overall crash rate (rank correlation 0.94). They say more about a city’s general traffic safety than about darkness. They can be provided upon request.
Cities left out. Eight cities with 50,000 or more residents were excluded because their annual crash records looked incomplete or inconsistent: Burbank, Folsom, Fountain Valley, Gardena, Westminster, Palo Alto, Yorba Linda and Hanford. Delano and Montebello use 2023 through 2025 records because of earlier data gaps.
Stability checks. We re-ran the rankings without the preliminary 2025 data, and they barely changed (agreement of 0.98 or higher for both measures). We also compared 2021 through 2023 with 2024 and 2025. Agreement was 0.83 for the unlit-road share and 0.73 for the dark share, so small differences in rank are not meaningful. We recounted every ranked city’s numbers independently from the raw files.
Limitations
- Injury and fatal crashes only. Crashes with only property damage are not in the data.
- No exposure data. The measures do not account for miles driven, traffic after dark, pedestrian activity or differences in local reporting.
- Officers record the lighting. Lighting conditions are the reporting officer’s judgment.
- Not a direct risk measure. A city’s dark share reflects when its crashes happen, so the rankings do not measure the risk to an individual driver or the effect of darkness on a city.
Have questions? Email andrea@getmaisonllaw.com.
Data for Every City Analyzed
This table lists all 173 cities in alphabetical order so reporters can find their own area. Total crashes are crashes with injury or death from 2021 through 2025 where the lighting was recorded. Daytime crashes happened in daylight, and the rest of the total happened at dusk or dawn. The dark share is crashes in the dark divided by total crashes. The unlit-road share is crashes in the dark on roads with no street lights, divided by all crashes in the dark. Ranks run from 1 (highest) to 173 (lowest) among the cities analyzed.
| City | County | 2025 population | Total crashes | Daytime crashes | Crashes in the dark | Dark share | Dark share rank | Dark crashes on unlit roads | Unlit-road share | Unlit-road share rank | Fatal crashes in the dark | Dark pedestrian crashes |
|---|---|---|---|---|---|---|---|---|---|---|---|---|
| Alameda | Alameda | 80,085 | 838 | 590 | 209 | 24.9% | 161 | 29 | 13.9% | 104 | 5 | 39 |
| Alhambra | Los Angeles | 82,728 | 1,516 | 1,055 | 424 | 28.0% | 117 | 111 | 26.2% | 20 | 5 | 28 |
| Aliso Viejo | Orange | 50,419 | 364 | 254 | 97 | 26.6% | 141 | 5 | 5.2% | 168 | 2 | 7 |
| Anaheim | Orange | 340,635 | 10,543 | 6,511 | 3,666 | 34.8% | 21 | 409 | 11.2% | 128 | 94 | 232 |
| Antioch | Contra Costa | 118,756 | 1,347 | 797 | 488 | 36.2% | 11 | 84 | 17.2% | 76 | 25 | 49 |
| Apple Valley | San Bernardino | 75,640 | 1,063 | 649 | 355 | 33.4% | 35 | 174 | 49.0% | 2 | 37 | 51 |
| Arcadia | Los Angeles | 56,329 | 1,297 | 904 | 346 | 26.7% | 139 | 35 | 10.1% | 139 | 8 | 23 |
| Bakersfield | Kern | 421,377 | 7,113 | 4,432 | 2,401 | 33.8% | 32 | 314 | 13.1% | 112 | 187 | 392 |
| Baldwin Park | Los Angeles | 70,800 | 1,932 | 1,238 | 614 | 31.8% | 57 | 119 | 19.4% | 60 | 8 | 24 |
| Beaumont | Riverside | 59,710 | 612 | 394 | 198 | 32.4% | 51 | 69 | 34.8% | 5 | 9 | 9 |
| Bellflower | Los Angeles | 76,449 | 1,988 | 1,260 | 652 | 32.8% | 46 | 84 | 12.9% | 114 | 26 | 68 |
| Berkeley | Alameda | 127,123 | 2,825 | 1,987 | 734 | 26.0% | 154 | 77 | 10.5% | 132 | 12 | 123 |
| Brentwood | Contra Costa | 66,332 | 752 | 497 | 231 | 30.7% | 79 | 28 | 12.1% | 120 | 11 | 17 |
| Buena Park | Orange | 83,219 | 1,540 | 973 | 505 | 32.8% | 47 | 48 | 9.5% | 149 | 25 | 45 |
| Camarillo | Ventura | 68,973 | 1,366 | 987 | 325 | 23.8% | 166 | 84 | 25.8% | 22 | 8 | 14 |
| Carlsbad | San Diego | 116,022 | 2,215 | 1,519 | 593 | 26.8% | 132 | 121 | 20.4% | 52 | 17 | 40 |
| Carson | Los Angeles | 92,206 | 2,005 | 1,277 | 625 | 31.2% | 72 | 75 | 12.0% | 122 | 17 | 67 |
| Cathedral City | Riverside | 51,715 | 533 | 297 | 219 | 41.1% | 2 | 45 | 20.5% | 51 | 19 | 16 |
| Chico | Butte | 108,026 | 1,143 | 758 | 343 | 30.0% | 91 | 60 | 17.5% | 75 | 12 | 66 |
| Chino | San Bernardino | 95,655 | 2,076 | 1,441 | 554 | 26.7% | 138 | 98 | 17.7% | 72 | 25 | 32 |
| Chino Hills | San Bernardino | 77,626 | 563 | 355 | 185 | 32.9% | 44 | 45 | 24.3% | 28 | 8 | 10 |
| Chula Vista | San Diego | 281,850 | 4,316 | 2,711 | 1,443 | 33.4% | 33 | 144 | 10.0% | 141 | 45 | 153 |
| Citrus Heights | Sacramento | 87,239 | 1,462 | 1,046 | 373 | 25.5% | 158 | 16 | 4.3% | 170 | 6 | 35 |
| Clovis | Fresno | 129,570 | 1,498 | 1,080 | 365 | 24.4% | 164 | 23 | 6.3% | 162 | 11 | 32 |
| Colton | San Bernardino | 53,219 | 2,042 | 1,285 | 676 | 33.1% | 39 | 152 | 22.5% | 41 | 37 | 61 |
| Compton | Los Angeles | 94,182 | 2,134 | 1,295 | 775 | 36.3% | 10 | 75 | 9.7% | 144 | 39 | 105 |
| Concord | Contra Costa | 123,075 | 2,557 | 1,684 | 778 | 30.4% | 88 | 119 | 15.3% | 86 | 23 | 60 |
| Corona | Riverside | 159,873 | 3,849 | 2,505 | 1,207 | 31.4% | 67 | 286 | 23.7% | 31 | 44 | 56 |
| Costa Mesa | Orange | 110,313 | 3,373 | 2,335 | 952 | 28.2% | 116 | 91 | 9.6% | 146 | 22 | 72 |
| Covina | Los Angeles | 51,066 | 493 | 332 | 148 | 30.0% | 90 | 9 | 6.1% | 163 | 1 | 22 |
| Cupertino | Santa Clara | 59,962 | 697 | 544 | 131 | 18.8% | 173 | 32 | 24.4% | 27 | 6 | 15 |
| Daly City | San Mateo | 102,215 | 1,300 | 790 | 453 | 34.8% | 19 | 67 | 14.8% | 90 | 13 | 80 |
| Davis | Yolo | 65,712 | 846 | 588 | 225 | 26.6% | 144 | 64 | 28.4% | 13 | 8 | 23 |
| Delano | Kern | 52,376 | 350 | 234 | 107 | 30.6% | 81 | 28 | 26.2% | 21 | 2 | 8 |
| Diamond Bar | Los Angeles | 53,796 | 1,865 | 1,286 | 512 | 27.5% | 121 | 152 | 29.7% | 11 | 20 | 18 |
| Downey | Los Angeles | 112,442 | 3,647 | 2,453 | 1,080 | 29.6% | 96 | 136 | 12.6% | 116 | 29 | 70 |
| Dublin | Alameda | 75,014 | 638 | 433 | 177 | 27.7% | 118 | 17 | 9.6% | 145 | 3 | 17 |
| Eastvale | Riverside | 69,987 | 817 | 549 | 236 | 28.9% | 107 | 34 | 14.4% | 96 | 6 | 14 |
| El Cajon | San Diego | 105,449 | 2,988 | 2,067 | 798 | 26.7% | 137 | 120 | 15.0% | 88 | 35 | 102 |
| El Monte | Los Angeles | 108,315 | 2,559 | 1,644 | 808 | 31.6% | 61 | 105 | 13.0% | 113 | 10 | 92 |
| Elk Grove | Sacramento | 184,495 | 2,185 | 1,527 | 584 | 26.7% | 133 | 92 | 15.8% | 83 | 19 | 34 |
| Encinitas | San Diego | 62,392 | 947 | 601 | 312 | 32.9% | 42 | 101 | 32.4% | 6 | 11 | 25 |
| Escondido | San Diego | 151,932 | 3,881 | 2,613 | 1,109 | 28.6% | 111 | 159 | 14.3% | 97 | 32 | 90 |
| Fairfield | Solano | 122,063 | 3,409 | 2,209 | 1,048 | 30.7% | 78 | 287 | 27.4% | 17 | 27 | 74 |
| Fontana | San Bernardino | 218,460 | 4,115 | 2,536 | 1,410 | 34.3% | 26 | 208 | 14.8% | 91 | 70 | 117 |
| Fremont | Alameda | 233,428 | 4,082 | 2,824 | 1,086 | 26.6% | 142 | 215 | 19.8% | 57 | 39 | 68 |
| Fresno | Fresno | 560,474 | 8,101 | 5,293 | 2,574 | 31.8% | 58 | 585 | 22.7% | 39 | 204 | 481 |
| Fullerton | Orange | 140,901 | 3,546 | 2,289 | 1,113 | 31.4% | 65 | 64 | 5.8% | 165 | 33 | 115 |
| Garden Grove | Orange | 171,668 | 3,153 | 2,043 | 989 | 31.4% | 66 | 89 | 9.0% | 151 | 34 | 119 |
| Gilroy | Santa Clara | 62,312 | 866 | 585 | 250 | 28.9% | 108 | 47 | 18.8% | 65 | 9 | 35 |
| Glendale | Los Angeles | 193,810 | 3,276 | 2,288 | 881 | 26.9% | 129 | 110 | 12.5% | 118 | 12 | 108 |
| Glendora | Los Angeles | 51,300 | 1,262 | 921 | 299 | 23.7% | 167 | 90 | 30.1% | 9 | 4 | 20 |
| Hawthorne | Los Angeles | 85,865 | 1,572 | 959 | 559 | 35.6% | 13 | 76 | 13.6% | 107 | 11 | 83 |
| Hayward | Alameda | 162,383 | 2,819 | 1,842 | 858 | 30.4% | 87 | 121 | 14.1% | 100 | 33 | 111 |
| Hemet | Riverside | 91,839 | 1,693 | 1,134 | 508 | 30.0% | 92 | 96 | 18.9% | 63 | 26 | 73 |
| Hesperia | San Bernardino | 102,613 | 2,627 | 1,688 | 868 | 33.0% | 40 | 482 | 55.5% | 1 | 61 | 69 |
| Highland | San Bernardino | 56,997 | 875 | 511 | 327 | 37.4% | 5 | 53 | 16.2% | 80 | 22 | 59 |
| Huntington Beach | Orange | 192,787 | 3,682 | 2,532 | 1,014 | 27.5% | 120 | 56 | 5.5% | 166 | 43 | 130 |
| Huntington Park | Los Angeles | 53,182 | 980 | 647 | 299 | 30.5% | 85 | 7 | 2.3% | 172 | 6 | 61 |
| Indio | Riverside | 92,552 | 926 | 574 | 327 | 35.3% | 15 | 48 | 14.7% | 93 | 23 | 52 |
| Inglewood | Los Angeles | 106,645 | 2,408 | 1,552 | 783 | 32.5% | 48 | 58 | 7.4% | 157 | 32 | 129 |
| Irvine | Orange | 317,652 | 3,751 | 2,627 | 992 | 26.4% | 145 | 174 | 17.5% | 74 | 33 | 59 |
| Jurupa Valley | Riverside | 106,178 | 2,875 | 1,750 | 1,014 | 35.3% | 16 | 298 | 29.4% | 12 | 56 | 78 |
| La Habra | Orange | 61,524 | 1,132 | 802 | 298 | 26.3% | 150 | 9 | 3.0% | 171 | 9 | 32 |
| La Mesa | San Diego | 61,863 | 1,589 | 1,011 | 509 | 32.0% | 55 | 106 | 20.8% | 48 | 11 | 38 |
| Laguna Niguel | Orange | 65,167 | 615 | 441 | 157 | 25.5% | 157 | 15 | 9.6% | 147 | 5 | 9 |
| Lake Elsinore | Riverside | 73,637 | 1,151 | 748 | 354 | 30.8% | 77 | 125 | 35.3% | 4 | 17 | 26 |
| Lake Forest | Orange | 88,017 | 957 | 628 | 292 | 30.5% | 84 | 37 | 12.7% | 115 | 11 | 20 |
| Lakewood | Los Angeles | 80,718 | 1,537 | 1,039 | 449 | 29.2% | 103 | 20 | 4.5% | 169 | 2 | 38 |
| Lancaster | Los Angeles | 177,170 | 5,103 | 3,396 | 1,501 | 29.4% | 101 | 198 | 13.2% | 111 | 71 | 142 |
| Lincoln | Placer | 55,431 | 286 | 177 | 92 | 32.2% | 53 | 23 | 25.0% | 25 | 4 | 7 |
| Livermore | Alameda | 86,447 | 1,755 | 1,216 | 469 | 26.7% | 135 | 111 | 23.7% | 32 | 10 | 21 |
| Lodi | San Joaquin | 68,468 | 664 | 414 | 231 | 34.8% | 20 | 22 | 9.5% | 148 | 13 | 37 |
| Long Beach | Los Angeles | 462,968 | 13,844 | 8,705 | 4,752 | 34.3% | 25 | 399 | 8.4% | 154 | 132 | 647 |
| Los Angeles | Los Angeles | 3,839,536 | 58,258 | 32,163 | 24,089 | 41.3% | 1 | 3,316 | 13.8% | 105 | 1,154 | 3,917 |
| Lynwood | Los Angeles | 66,675 | 1,498 | 922 | 510 | 34.0% | 30 | 78 | 15.3% | 87 | 13 | 45 |
| Madera | Madera | 68,458 | 868 | 516 | 322 | 37.1% | 7 | 69 | 21.4% | 46 | 21 | 58 |
| Manteca | San Joaquin | 94,951 | 1,445 | 1,008 | 378 | 26.2% | 151 | 105 | 27.8% | 14 | 16 | 37 |
| Menifee | Riverside | 115,813 | 1,387 | 929 | 400 | 28.8% | 109 | 120 | 30.0% | 10 | 10 | 26 |
| Merced | Merced | 98,655 | 1,877 | 1,238 | 586 | 31.2% | 71 | 100 | 17.1% | 77 | 30 | 100 |
| Milpitas | Santa Clara | 81,821 | 1,265 | 805 | 386 | 30.5% | 83 | 107 | 27.7% | 15 | 9 | 28 |
| Mission Viejo | Orange | 91,219 | 1,348 | 914 | 382 | 28.3% | 114 | 81 | 21.2% | 47 | 12 | 18 |
| Modesto | Stanislaus | 220,526 | 6,977 | 4,679 | 2,042 | 29.3% | 102 | 154 | 7.5% | 156 | 62 | 226 |
| Montebello | Los Angeles | 62,619 | 852 | 555 | 270 | 31.7% | 59 | 31 | 11.5% | 125 | 5 | 31 |
| Monterey Park | Los Angeles | 59,898 | 1,266 | 862 | 343 | 27.1% | 126 | 57 | 16.6% | 79 | 8 | 42 |
| Moreno Valley | Riverside | 210,740 | 4,017 | 2,460 | 1,375 | 34.2% | 28 | 193 | 14.0% | 102 | 41 | 104 |
| Mountain View | Santa Clara | 86,944 | 1,837 | 1,338 | 422 | 23.0% | 170 | 99 | 23.5% | 34 | 9 | 47 |
| Murrieta | Riverside | 111,951 | 1,909 | 1,345 | 504 | 26.4% | 146 | 152 | 30.2% | 8 | 23 | 17 |
| Napa | Napa | 78,045 | 1,227 | 826 | 357 | 29.1% | 105 | 37 | 10.4% | 134 | 4 | 48 |
| National City | San Diego | 58,649 | 1,589 | 1,004 | 530 | 33.4% | 36 | 97 | 18.3% | 68 | 20 | 67 |
| Newport Beach | Orange | 83,041 | 1,921 | 1,382 | 480 | 25.0% | 160 | 29 | 6.0% | 164 | 16 | 55 |
| Norwalk | Los Angeles | 101,780 | 2,117 | 1,314 | 731 | 34.5% | 22 | 168 | 23.0% | 36 | 19 | 69 |
| Novato | Marin | 52,198 | 822 | 564 | 217 | 26.4% | 147 | 55 | 25.3% | 24 | 4 | 20 |
| Oakland | Alameda | 429,732 | 10,511 | 6,469 | 3,504 | 33.3% | 37 | 565 | 16.1% | 81 | 106 | 482 |
| Oceanside | San Diego | 175,193 | 3,790 | 2,365 | 1,266 | 33.4% | 34 | 158 | 12.5% | 119 | 40 | 114 |
| Ontario | San Bernardino | 185,346 | 5,622 | 3,625 | 1,818 | 32.3% | 52 | 361 | 19.9% | 56 | 66 | 122 |
| Orange | Orange | 141,825 | 3,663 | 2,456 | 1,083 | 29.6% | 97 | 126 | 11.6% | 124 | 28 | 83 |
| Oxnard | Ventura | 199,319 | 4,867 | 3,088 | 1,553 | 31.9% | 56 | 109 | 7.0% | 158 | 29 | 145 |
| Palm Desert | Riverside | 51,662 | 1,086 | 812 | 236 | 21.7% | 172 | 33 | 14.0% | 103 | 11 | 21 |
| Palmdale | Los Angeles | 166,554 | 3,689 | 2,277 | 1,218 | 33.0% | 41 | 242 | 19.9% | 55 | 64 | 97 |
| Paramount | Los Angeles | 52,560 | 1,235 | 802 | 389 | 31.5% | 64 | 65 | 16.7% | 78 | 15 | 24 |
| Pasadena | Los Angeles | 141,466 | 4,310 | 3,025 | 1,125 | 26.1% | 153 | 119 | 10.6% | 131 | 22 | 116 |
| Perris | Riverside | 81,100 | 1,485 | 892 | 541 | 36.4% | 8 | 122 | 22.6% | 40 | 19 | 43 |
| Petaluma | Sonoma | 59,395 | 889 | 635 | 215 | 24.2% | 165 | 31 | 14.4% | 95 | 3 | 19 |
| Pico Rivera | Los Angeles | 61,219 | 904 | 548 | 327 | 36.2% | 12 | 25 | 7.6% | 155 | 14 | 41 |
| Pittsburg | Contra Costa | 76,922 | 920 | 526 | 358 | 38.9% | 3 | 69 | 19.3% | 61 | 17 | 38 |
| Placentia | Orange | 53,723 | 773 | 544 | 207 | 26.8% | 131 | 11 | 5.3% | 167 | 5 | 13 |
| Pleasanton | Alameda | 76,659 | 1,619 | 1,174 | 378 | 23.3% | 168 | 117 | 31.0% | 7 | 10 | 20 |
| Pomona | Los Angeles | 154,762 | 4,812 | 2,891 | 1,750 | 36.4% | 9 | 308 | 17.6% | 73 | 39 | 177 |
| Porterville | Tulare | 63,899 | 1,376 | 979 | 353 | 25.7% | 156 | 78 | 22.1% | 43 | 15 | 36 |
| Poway | San Diego | 50,699 | 381 | 270 | 95 | 24.9% | 162 | 18 | 18.9% | 62 | 6 | 6 |
| Rancho Cordova | Sacramento | 85,789 | 1,228 | 874 | 307 | 25.0% | 159 | 35 | 11.4% | 126 | 22 | 46 |
| Rancho Cucamonga | San Bernardino | 176,846 | 2,627 | 1,709 | 803 | 30.6% | 82 | 146 | 18.2% | 70 | 35 | 60 |
| Redding | Shasta | 94,240 | 1,656 | 1,215 | 375 | 22.6% | 171 | 103 | 27.5% | 16 | 31 | 62 |
| Redlands | San Bernardino | 74,013 | 2,520 | 1,566 | 860 | 34.1% | 29 | 198 | 23.0% | 35 | 27 | 63 |
| Redondo Beach | Los Angeles | 68,528 | 1,190 | 811 | 340 | 28.6% | 112 | 2 | 0.6% | 173 | 4 | 39 |
| Redwood City | San Mateo | 82,109 | 1,461 | 980 | 437 | 29.9% | 93 | 81 | 18.5% | 67 | 11 | 50 |
| Rialto | San Bernardino | 106,104 | 2,187 | 1,304 | 826 | 37.8% | 4 | 117 | 14.2% | 99 | 49 | 83 |
| Richmond | Contra Costa | 114,415 | 2,101 | 1,355 | 654 | 31.1% | 73 | 158 | 24.2% | 30 | 33 | 75 |
| Riverside | Riverside | 321,263 | 9,391 | 6,003 | 3,083 | 32.8% | 45 | 579 | 18.8% | 66 | 114 | 218 |
| Rocklin | Placer | 74,483 | 762 | 509 | 234 | 30.7% | 80 | 24 | 10.3% | 136 | 5 | 11 |
| Rosemead | Los Angeles | 51,233 | 1,076 | 712 | 334 | 31.0% | 75 | 49 | 14.7% | 94 | 9 | 34 |
| Roseville | Placer | 161,162 | 3,532 | 2,420 | 944 | 26.7% | 134 | 95 | 10.1% | 140 | 22 | 53 |
| Sacramento | Sacramento | 532,956 | 18,001 | 11,747 | 5,685 | 31.6% | 60 | 773 | 13.6% | 106 | 181 | 592 |
| Salinas | Monterey | 160,784 | 2,100 | 1,359 | 662 | 31.5% | 63 | 65 | 9.8% | 142 | 10 | 127 |
| San Bernardino | San Bernardino | 223,313 | 6,539 | 3,876 | 2,428 | 37.1% | 6 | 505 | 20.8% | 49 | 149 | 359 |
| San Clemente | Orange | 63,133 | 957 | 621 | 291 | 30.4% | 89 | 41 | 14.1% | 101 | 12 | 20 |
| San Diego | San Diego | 1,409,429 | 28,415 | 17,614 | 9,807 | 34.5% | 23 | 2,128 | 21.7% | 45 | 364 | 1,236 |
| San Francisco | San Francisco | 844,394 | 16,708 | 10,263 | 5,860 | 35.1% | 17 | 371 | 6.3% | 161 | 118 | 1,101 |
| San Jacinto | Riverside | 54,815 | 943 | 586 | 325 | 34.5% | 24 | 50 | 15.4% | 85 | 23 | 36 |
| San Jose | Santa Clara | 983,264 | 16,662 | 10,819 | 5,221 | 31.3% | 69 | 1,050 | 20.1% | 54 | 173 | 608 |
| San Leandro | Alameda | 87,387 | 1,583 | 983 | 525 | 33.2% | 38 | 71 | 13.5% | 108 | 13 | 63 |
| San Marcos | San Diego | 97,647 | 1,423 | 924 | 456 | 32.0% | 54 | 99 | 21.7% | 44 | 18 | 30 |
| San Mateo | San Mateo | 104,361 | 1,688 | 1,171 | 450 | 26.7% | 140 | 85 | 18.9% | 64 | 10 | 41 |
| San Rafael | Marin | 60,184 | 1,451 | 968 | 432 | 29.8% | 94 | 85 | 19.7% | 58 | 9 | 57 |
| San Ramon | Contra Costa | 84,173 | 726 | 498 | 205 | 28.2% | 115 | 47 | 22.9% | 38 | 4 | 13 |
| Santa Ana | Orange | 312,796 | 8,319 | 5,582 | 2,451 | 29.5% | 99 | 165 | 6.7% | 160 | 97 | 307 |
| Santa Barbara | Santa Barbara | 85,752 | 2,302 | 1,600 | 615 | 26.7% | 136 | 111 | 18.0% | 71 | 16 | 68 |
| Santa Clara | Santa Clara | 134,088 | 1,682 | 1,139 | 481 | 28.6% | 110 | 52 | 10.8% | 129 | 17 | 60 |
| Santa Clarita | Los Angeles | 232,635 | 3,484 | 2,256 | 1,061 | 30.5% | 86 | 194 | 18.3% | 69 | 23 | 52 |
| Santa Cruz | Santa Cruz | 62,999 | 720 | 483 | 208 | 28.9% | 106 | 33 | 15.9% | 82 | 9 | 48 |
| Santa Maria | Santa Barbara | 111,356 | 1,996 | 1,275 | 630 | 31.6% | 62 | 64 | 10.2% | 137 | 15 | 60 |
| Santa Monica | Los Angeles | 93,876 | 2,135 | 1,496 | 581 | 27.2% | 124 | 57 | 9.8% | 143 | 14 | 118 |
| Santa Rosa | Sonoma | 178,786 | 2,342 | 1,605 | 640 | 27.3% | 123 | 94 | 14.7% | 92 | 18 | 79 |
| Santee | San Diego | 60,044 | 383 | 267 | 106 | 27.7% | 119 | 12 | 11.3% | 127 | 5 | 4 |
| Simi Valley | Ventura | 125,093 | 1,785 | 1,233 | 490 | 27.5% | 122 | 65 | 13.3% | 110 | 15 | 35 |
| South Gate | Los Angeles | 93,411 | 2,085 | 1,310 | 714 | 34.2% | 27 | 65 | 9.1% | 150 | 7 | 65 |
| South San Francisco | San Mateo | 65,431 | 1,241 | 812 | 389 | 31.3% | 68 | 34 | 8.7% | 152 | 14 | 49 |
| Stockton | San Joaquin | 323,077 | 7,029 | 4,833 | 1,911 | 27.2% | 125 | 224 | 11.7% | 123 | 95 | 268 |
| Sunnyvale | Santa Clara | 159,955 | 2,039 | 1,396 | 547 | 26.8% | 130 | 111 | 20.3% | 53 | 15 | 67 |
| Temecula | Riverside | 112,662 | 2,467 | 1,734 | 650 | 26.3% | 149 | 174 | 26.8% | 19 | 13 | 40 |
| Thousand Oaks | Ventura | 122,688 | 2,630 | 1,933 | 605 | 23.0% | 169 | 142 | 23.5% | 33 | 10 | 29 |
| Torrance | Los Angeles | 144,041 | 2,459 | 1,702 | 649 | 26.4% | 148 | 44 | 6.8% | 159 | 17 | 61 |
| Tracy | San Joaquin | 98,776 | 1,096 | 754 | 311 | 28.4% | 113 | 77 | 24.8% | 26 | 11 | 22 |
| Tulare | Tulare | 72,495 | 351 | 225 | 119 | 33.9% | 31 | 32 | 26.9% | 18 | 20 | 29 |
| Turlock | Stanislaus | 72,727 | 1,635 | 1,046 | 531 | 32.5% | 49 | 64 | 12.1% | 121 | 20 | 45 |
| Tustin | Orange | 79,650 | 1,760 | 1,185 | 523 | 29.7% | 95 | 53 | 10.1% | 138 | 9 | 43 |
| Union City | Alameda | 67,036 | 862 | 600 | 225 | 26.1% | 152 | 19 | 8.4% | 153 | 5 | 39 |
| Upland | San Bernardino | 78,996 | 2,379 | 1,536 | 743 | 31.2% | 70 | 77 | 10.4% | 135 | 20 | 41 |
| Vacaville | Solano | 103,743 | 1,650 | 1,105 | 487 | 29.5% | 98 | 118 | 24.2% | 29 | 11 | 34 |
| Vallejo | Solano | 123,140 | 2,307 | 1,404 | 809 | 35.1% | 18 | 158 | 19.5% | 59 | 49 | 115 |
| Ventura (San Buenaventura) | Ventura | 108,325 | 3,225 | 2,248 | 869 | 26.9% | 128 | 194 | 22.3% | 42 | 28 | 80 |
| Victorville | San Bernardino | 141,098 | 2,500 | 1,568 | 823 | 32.9% | 43 | 189 | 23.0% | 37 | 82 | 108 |
| Visalia | Tulare | 147,991 | 2,029 | 1,398 | 547 | 27.0% | 127 | 81 | 14.8% | 89 | 31 | 84 |
| Vista | San Diego | 101,934 | 1,463 | 901 | 519 | 35.5% | 14 | 80 | 15.4% | 84 | 18 | 45 |
| Walnut Creek | Contra Costa | 70,736 | 1,494 | 1,006 | 440 | 29.5% | 100 | 63 | 14.3% | 98 | 10 | 27 |
| Watsonville | Santa Cruz | 50,826 | 624 | 450 | 154 | 24.7% | 163 | 16 | 10.4% | 133 | 8 | 41 |
| West Covina | Los Angeles | 109,546 | 2,099 | 1,368 | 652 | 31.1% | 74 | 70 | 10.7% | 130 | 27 | 41 |
| West Sacramento | Yolo | 55,376 | 1,377 | 923 | 402 | 29.2% | 104 | 103 | 25.6% | 23 | 14 | 32 |
| Whittier | Los Angeles | 88,327 | 1,818 | 1,163 | 589 | 32.4% | 50 | 74 | 12.6% | 117 | 14 | 60 |
| Woodland | Yolo | 61,693 | 673 | 471 | 179 | 26.6% | 143 | 37 | 20.7% | 50 | 7 | 31 |
| Yuba City | Sutter | 71,205 | 1,290 | 910 | 334 | 25.9% | 155 | 45 | 13.5% | 109 | 10 | 43 |
| Yucaipa | San Bernardino | 55,008 | 752 | 486 | 232 | 30.9% | 76 | 85 | 36.6% | 3 | 8 | 14 |
Above table: Maison Law analysis of state crash records (TIMS), 2021 through 2025,2 and 2025 population estimates from the California Department of Finance.3 Shares from cities with fewer crashes are less reliable, so small differences in rank are not meaningful. Delano and Montebello use 2023 through 2025 records. Eight other cities with 50,000 or more residents are not ranked because of incomplete records (see Methodology).
Sources
- National Institute of Standards and Technology, Daylight Saving Time Rules
- UC Berkeley SafeTREC, Transportation Injury Mapping System (TIMS). Fatal and injury crash records from the California Statewide Integrated Traffic Records System (SWITRS), 2021 through 2025, downloaded October 16, 2026.
- California Department of Finance, E-5 Population and Housing Estimates for Cities, Counties and the State, January 1, 2021–2025
- Insurance Institute for Highway Safety, Changing the clocks helps pedestrians but hurts motorists, and Woods, Weast and Monfort, Daylight saving time and fatal crashes: the impact of changing light conditions, Journal of Safety Research, 2025
- GovInfo, H.R. 139, Sunshine Protection Act of 2025
- California Legislative Analyst’s Office, Proposition 7 analysis, November 2018
- Automobile Club of Southern California (AAA), Auto Club Reminds Drivers and Pedestrians To Be Cautious As Daylight Saving Time Ends, October 30, 2025
Report prepared by Maison Law, October 31, 2026.
