When people talk about “dangerous cars,” the conversation usually turns to safety ratings, recalls, or crash test results. But there’s another way to look at risk: which vehicles show up most often in fatal crashes, and what actually happens in those crashes.
Using federal crash data from 2019 to 2023, we analyzed hundreds of thousands of fatal accidents to see which car models, brands, and driving scenarios appear most often when tragedies happen on U.S. roads. The results highlight some clear patterns and a few surprising ones.
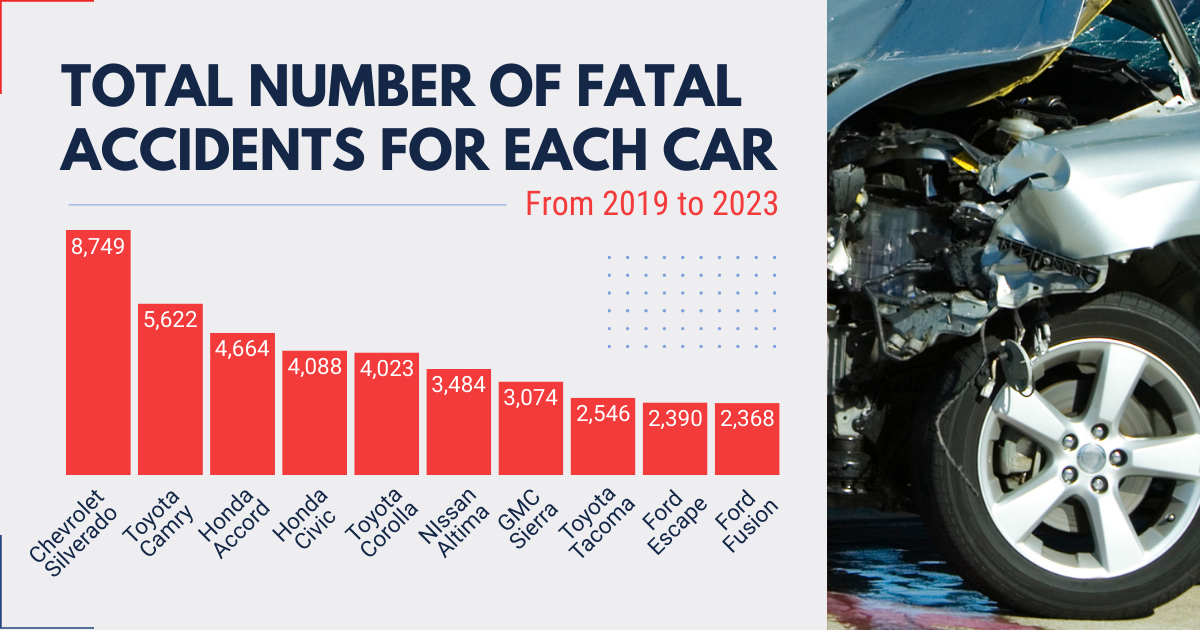
The Deadliest Car Models (By Total Fatal Accidents)
When we look at fatal crash totals by individual vehicle model, one name stands out far above the rest: the Chevrolet Silverado. Between 2019 and 2023, the Silverado was involved in 8,749 fatal crashes, more than any other model in the dataset.
Several of the other vehicles near the top of the list are also some of the most popular cars in the U.S., including the Toyota Camry, Honda Accord, Honda Civic, and Toyota Corolla.
It’s important to note that these vehicles are also some of the most popular cars and trucks in America, which means higher exposure on the road. High rankings here don’t automatically mean a model is “unsafe” in design, but they do show which vehicles are most often involved when fatal crashes happen.
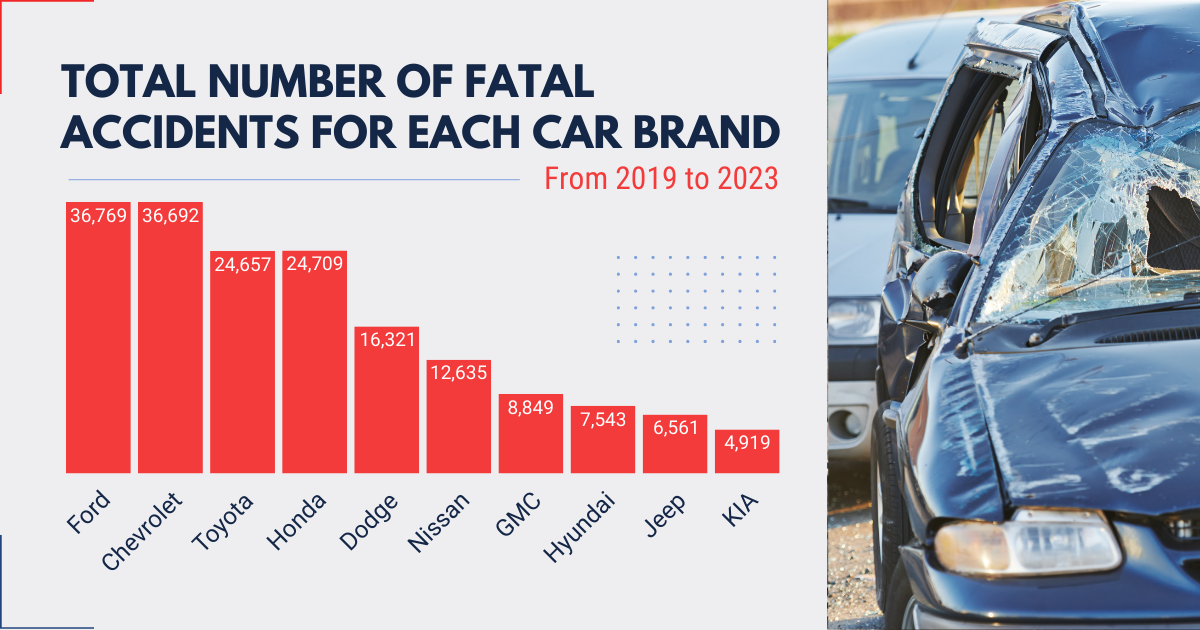
Which Brands Are Involved in the Most Fatal Crashes?
Zooming out from individual models to entire brands, two manufacturers clearly dominate the fatal crash totals: Ford and Chevrolet. Over the five-year period we analyzed, each brand was associated with more than 36,000 vehicles involved in fatal crashes, putting them well ahead of every other automaker in the dataset.
This gap isn’t especially surprising when you consider market share. Ford and Chevrolet consistently rank among the top-selling brands in the U.S., particularly because of their strong lineups of trucks, SUVs, and widely used passenger vehicles. More vehicles on the road means more total miles driven and, inevitably, more involvement in serious crashes.
Brands like Toyota and Honda follow next, also reflecting their massive presence in everyday driving.
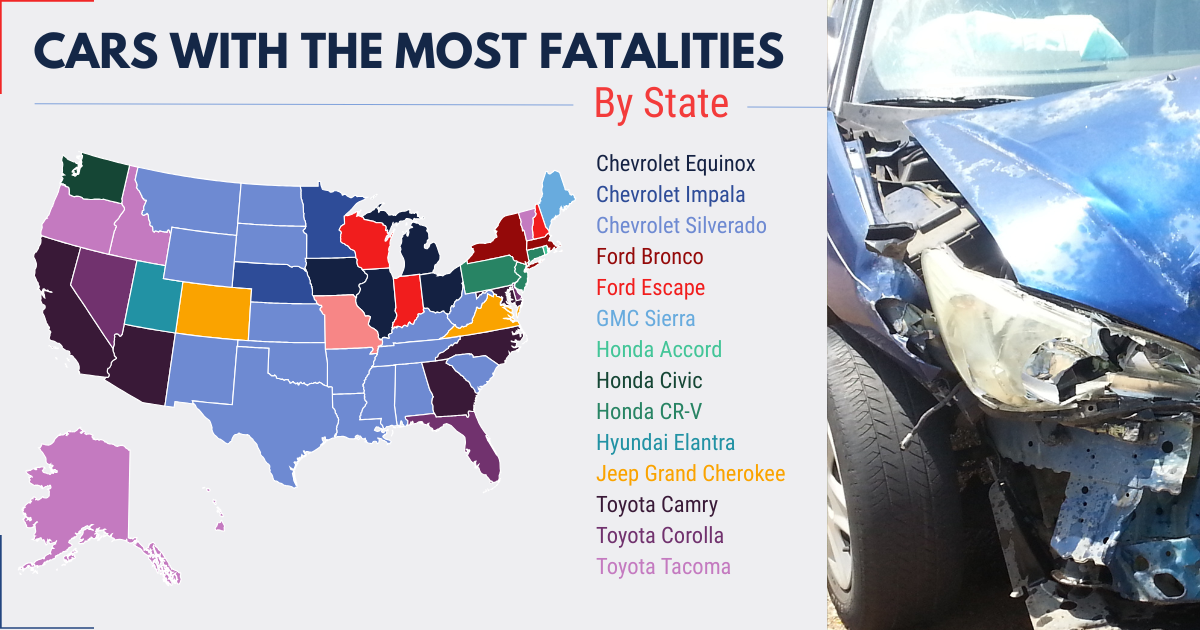
The Most Dangerous Cars by State
Risk doesn’t look the same everywhere.
When you break the data down by state, different models emerge as the most dangerous depending on local driving patterns, road types, weather, and vehicle popularity. In some states, pickups dominate fatal crash counts. In others, sedans or SUVs appear more often.
What Actually Goes Wrong in These Crashes?
- Toyota Camry – Collision with pedestrian
- Honda Accord – Hit curb
- Honda Civic – Hit curb
- Toyota Corolla – Collision with another vehicle
- Ford Escape – Collision with another vehicle
- Ford Fusion – Collision with another vehicle
- Nissan Altima – Collision with tree
What This Data Really Means for Drivers
It’s tempting to read lists like these as a ranking of “unsafe” cars, but that would miss the bigger picture. The vehicles that appear most often in fatal crash data are usually the ones that are driven the most, in the widest range of conditions, by the largest number of people. Popularity and exposure play a huge role in these totals.
What this data really highlights is how risk is shaped by behavior, environment, and usage patterns. Speed, distraction, impairment, and road design remain the biggest drivers of fatal crashes, no matter what badge is on the front of the car.
Methodology: We used NHTSA FARS to pull data from 287,061 vehicles involved in fatal crashes between 2019 and 2023.